
 Preparing a product formulation dataset for predictive modeling is neither a trivial nor glamourous task. Dataset assembly commonly presents numerous challenges along the route from locating the relevant data, to structuring it, and detecting and resolving anomalies.
It’s a major milestone to find yourself at the point of being ready to build a model.
The excitement of it all, paired with the streamlined workflow in FormuSense, can tempt novice users to hastily trust an initial model and begin performing simulation and optimization before carefully fine-tuning and validating the underlying model. However, many tools and features have been thoughtfully included in the Modeling stage of FormuSense to encourage just the opposite.
Case Study: High-Performance Coatings
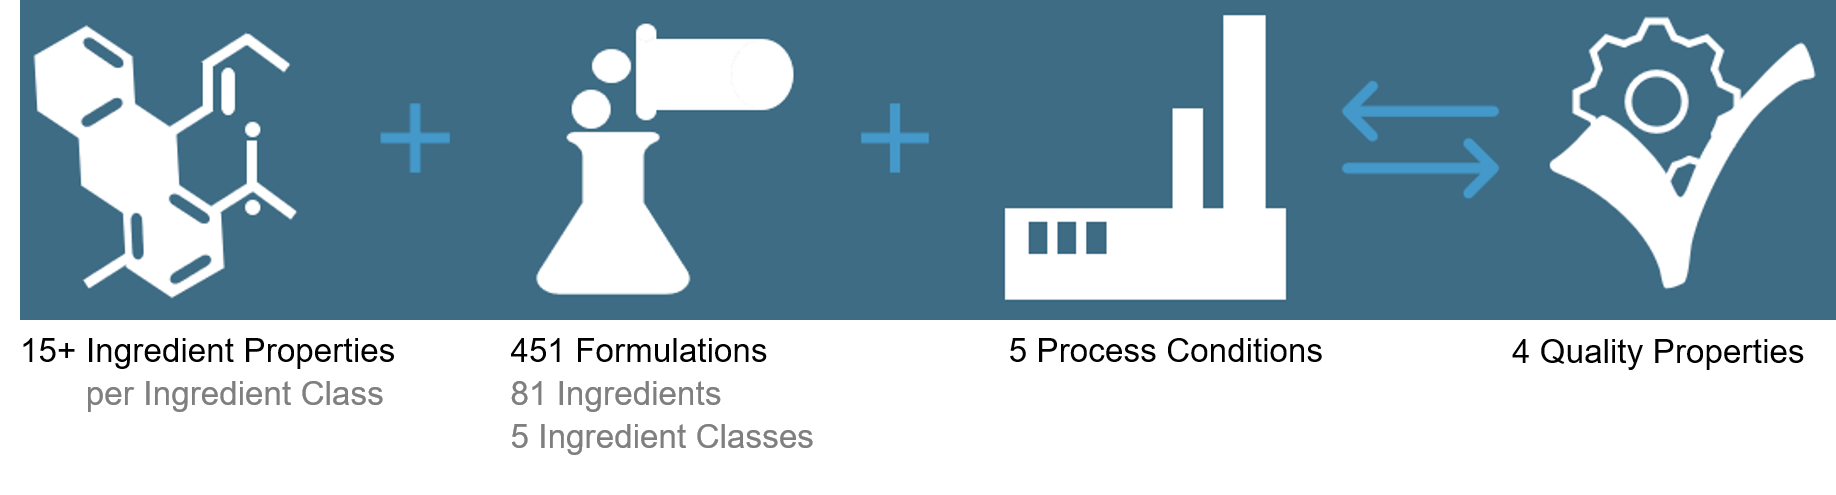
To explore the importance of model tuning and validation, let us consider a high-performance coatings dataset. The goal in this case is to build a PLS model on four quality variables.
Model Setup
Mandatory Model Validation
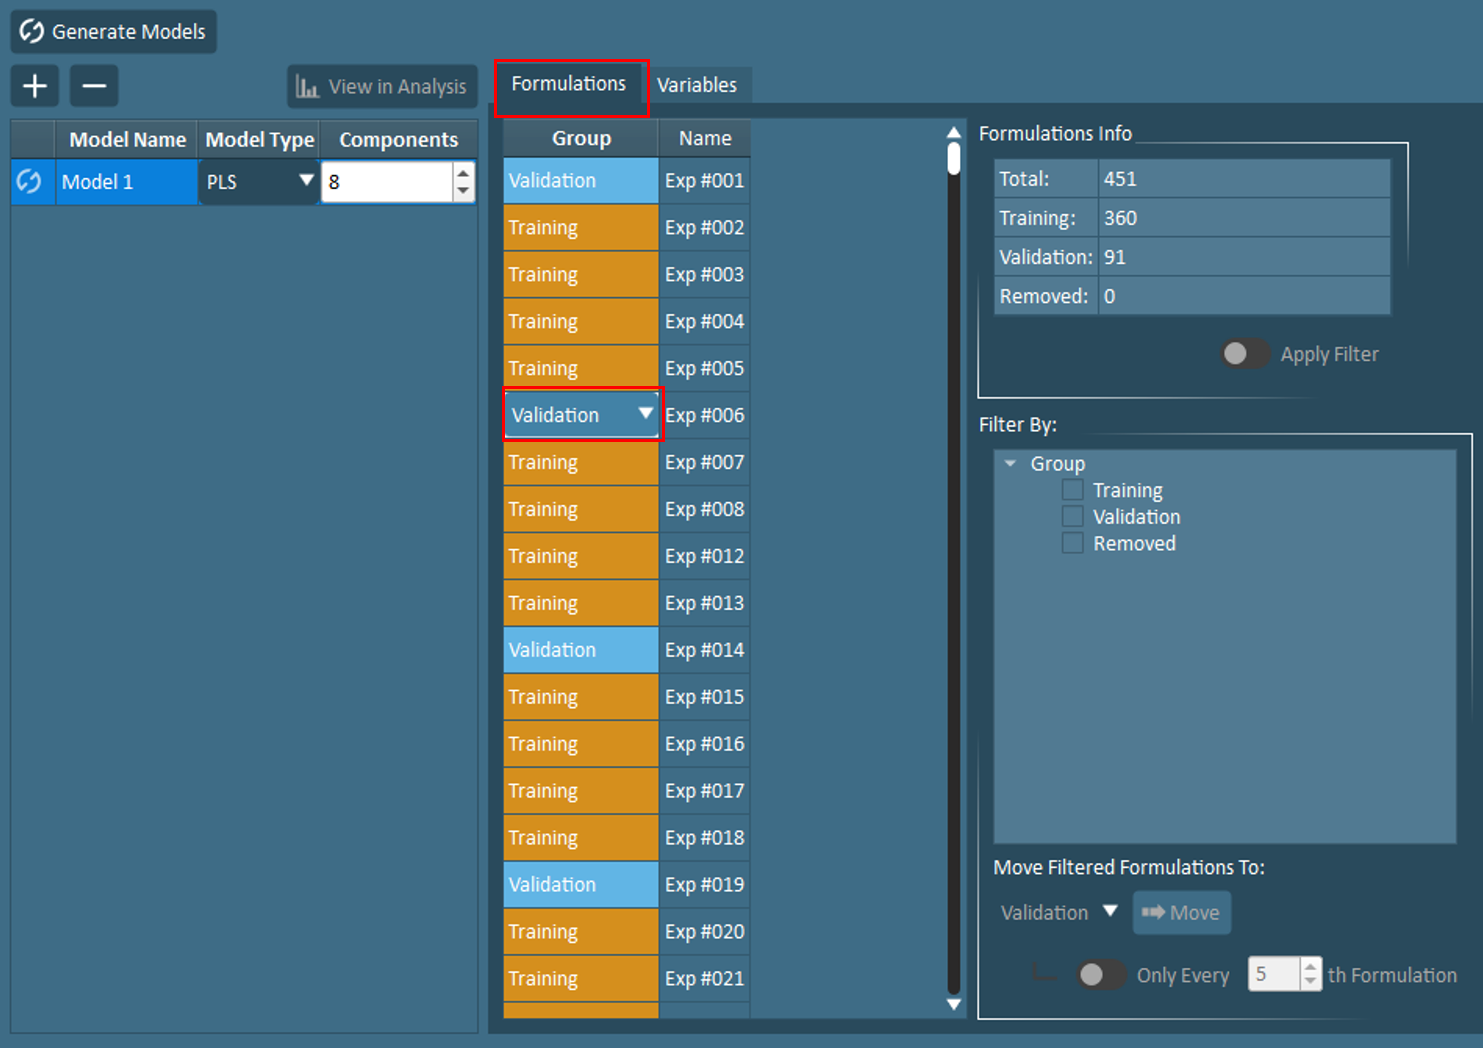 In the Formulations tab found under Modeling Setup, users will notice that each historical formulation must be assigned to one of three groups: training, validation, or removed. Owing to the importance of model validation, FormuSense does not allow users to build a model without at least 1 validation point. In fact, by default, every 5th formulation is assigned to the validation group. The purpose of model validation is to test the model on unseen data; this is an effective way to identify issues such as an overfit model.
Plots in Modeling Analysis that aim to educate users on model performance with training and validation data will be discussed shortly.
Missing Data and Insufficient Variation
Next, in the Variables tab under Modeling Setup, FormuSense provides default variable selections to prevent inclusion of variables with a high percentage of missing data or insufficient variation, and discourage the use of ingredient ratios. However, users have the ability to include or exclude variables at their discretion.
Select Number of Principal Components
As the number of variables included in the model is updated by the user, the suggested number of Principal Components (components) will automatically update as well. In FormuSense, the number of components is defaulted to the square root of the number of X+Y variables in the model. While this does not always provide the optimal number of components, it typically provides a useful starting point.

Model Interpretation
After formulations and variables have been configured, FormuSense users may Generate Models to begin interpreting the initial model results. The three pre-configured views aim to provide an overall Summary of the model fit and key correlations, assist with model Pruning, and complete a detailed Interpretation of results. Across all three views, results are initially distinctly presented for the Train/Validation model (which use the specified training and validation groups). This feature encourages users to verify the appropriateness of the number of components (aka model tuning parameter) and selection of training and validation groups.
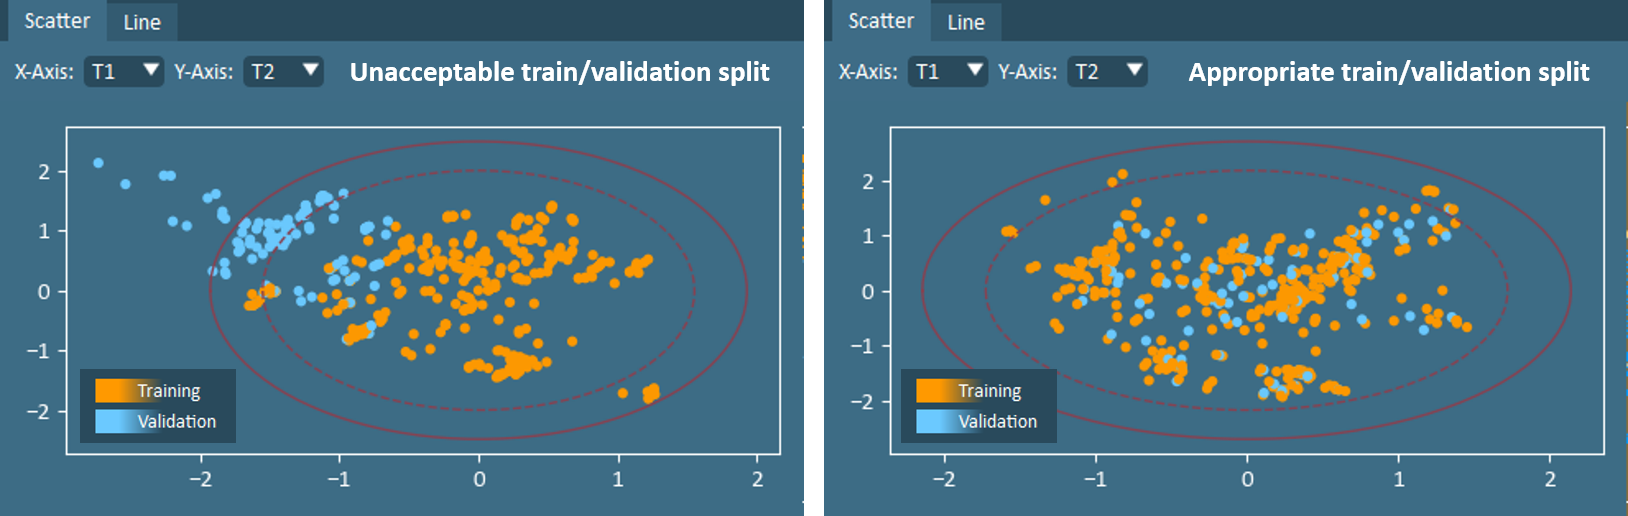
Scrutinize Train/Validation Split
Ensuring that a validation set is appropriate for the dataset and modeling goals is an important task. In most cases, a validation group should span, but neither cluster nor extrapolate from, the multivariate design space. It should also not contain repeats that are included in the training data. The score plot is an effective starting point for assessing whether the validation group is sufficient, or if further modifications should be made. When needed, the Plot Selection and Move Selected To tools found in Modeling Analysis can be used together to readily adjust the train/validation split from any plot containing formulation datapoints. Alternatively, users may navigate back to Modeling Setup to view and edit the list of formulations manually or with the Filter By and Move Filtered Formulations To tools.
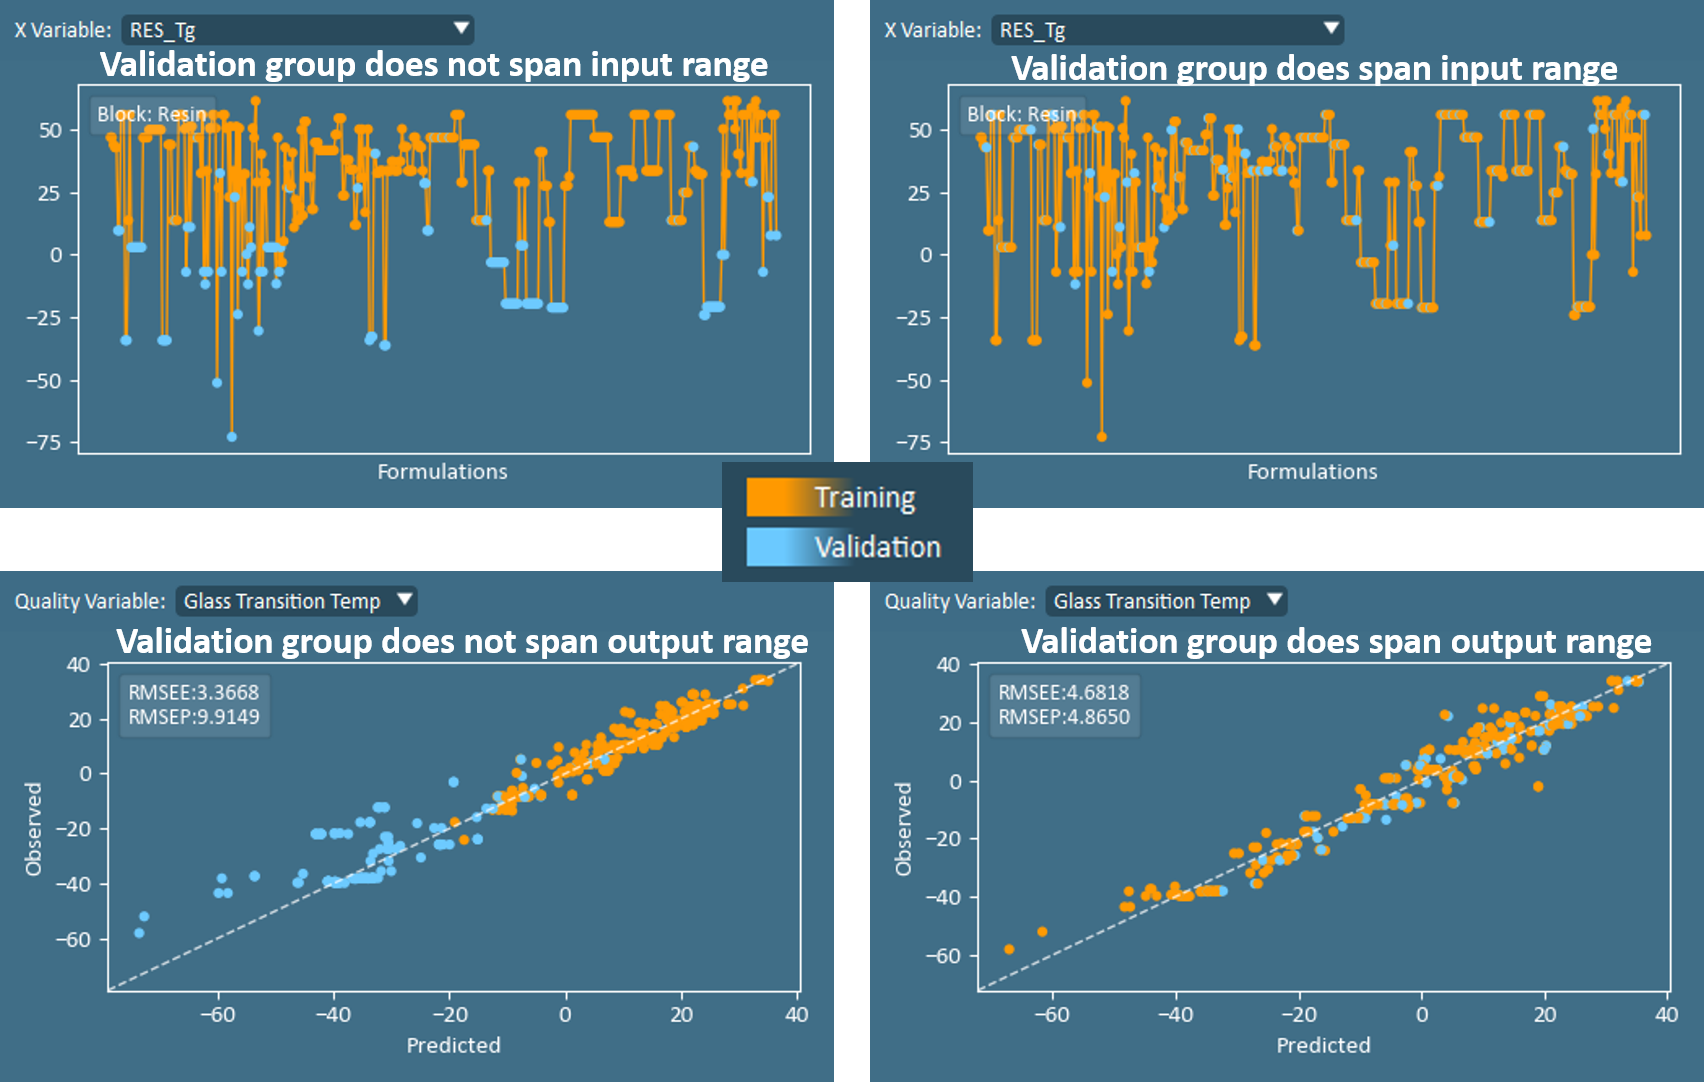
After the score plot suggests that an appropriate train/validation split has been specified, it is diligent to further review Raw Data Line Plots (x-data) and the Observed vs Predicted plots (y-data) to ensure that the validation group spans the range of values for all input and output variables, or for the anticipated values where the model will be applied in the future.
Confirm Number of Principal Components
With the train/validation split finalized, the Observed vs Predicted and Model Fit (R2) are two of the most useful plots for beginning to assess if the number of components is appropriate.
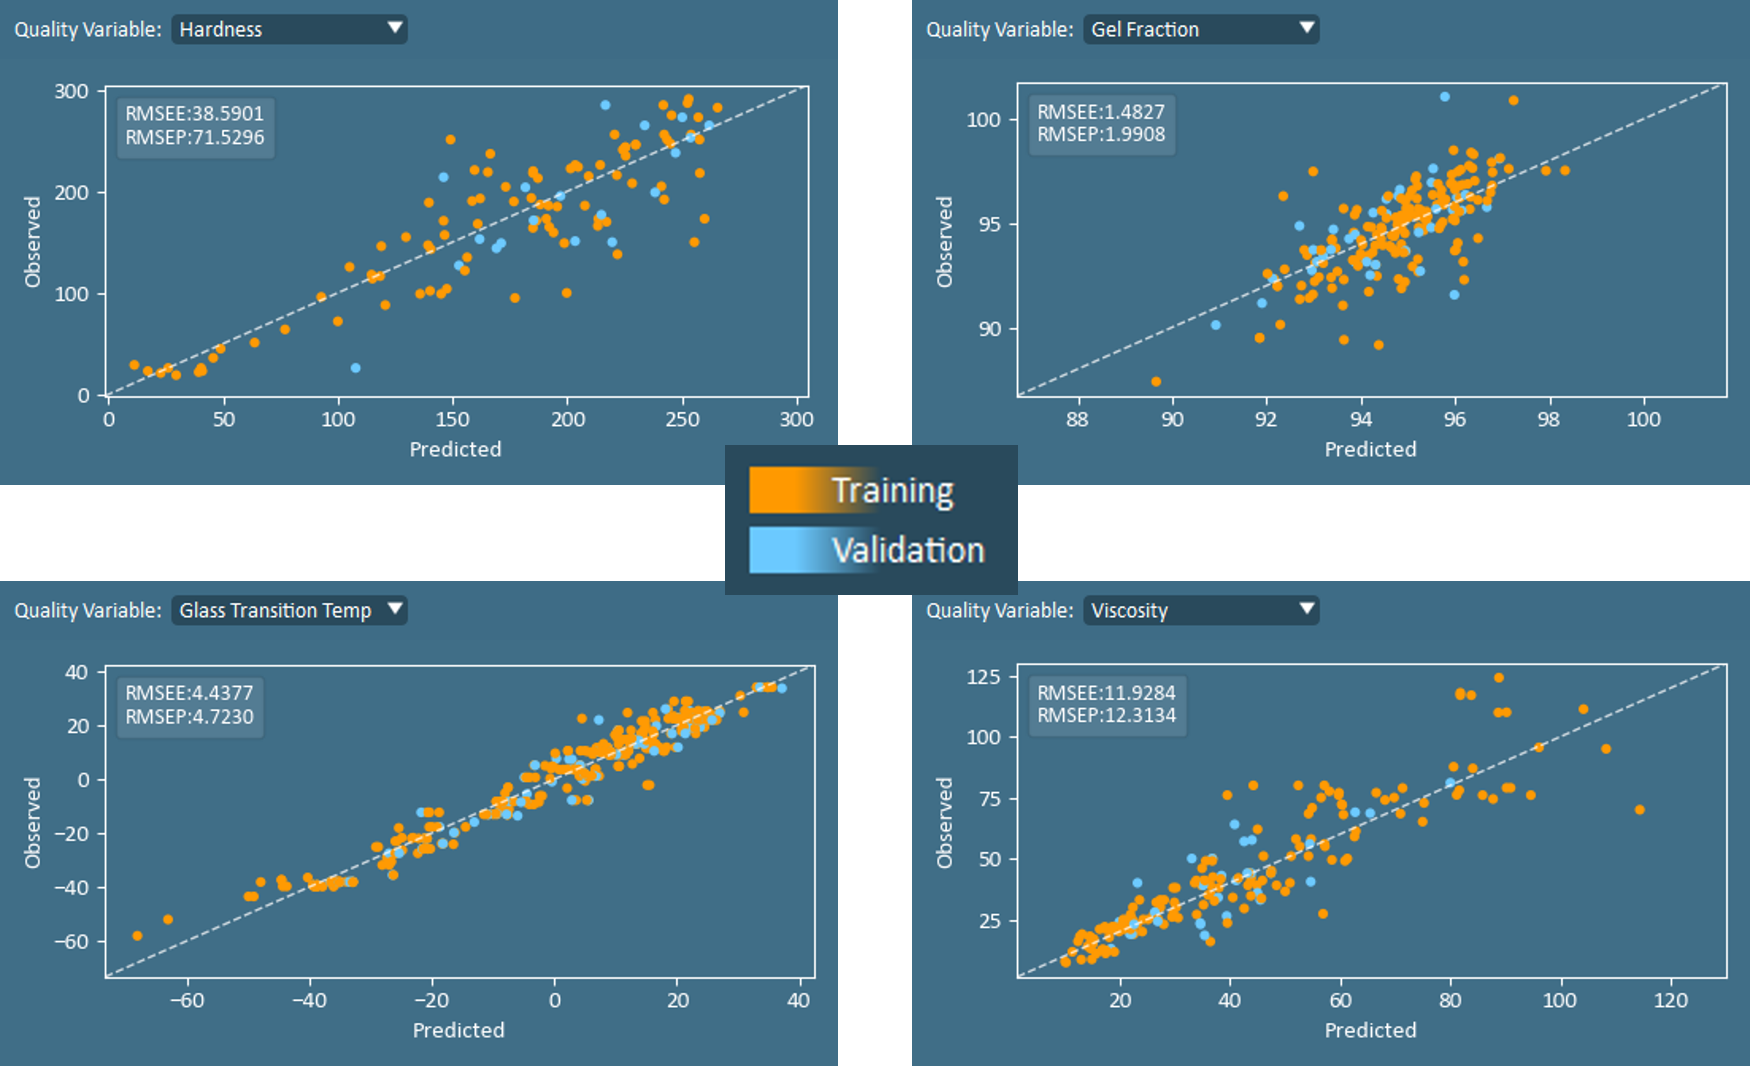
Continuing with Observed vs Predicted plot, users may visually interpret the model fit on validation data compared to training data. In addition, two numerical values are annotated on this plot: RMSEE and RMSEP. RMSEE is the root mean squared error of estimation (of the training set), while the RMSEP is the RMSE of prediction (of the validation set). In an ideal model, the error in predicting the quality properties for the validation set (RMSEP) is similar to the error of prediction on the model training set (RMSEE). Large differences between RMSEE and RMSEP indicate a model which is either underfit or overfit, and users should explore the effect of adding or removing components.
The set of Model Fit (R2) plots are also very helpful for tuning the number of components in a model.
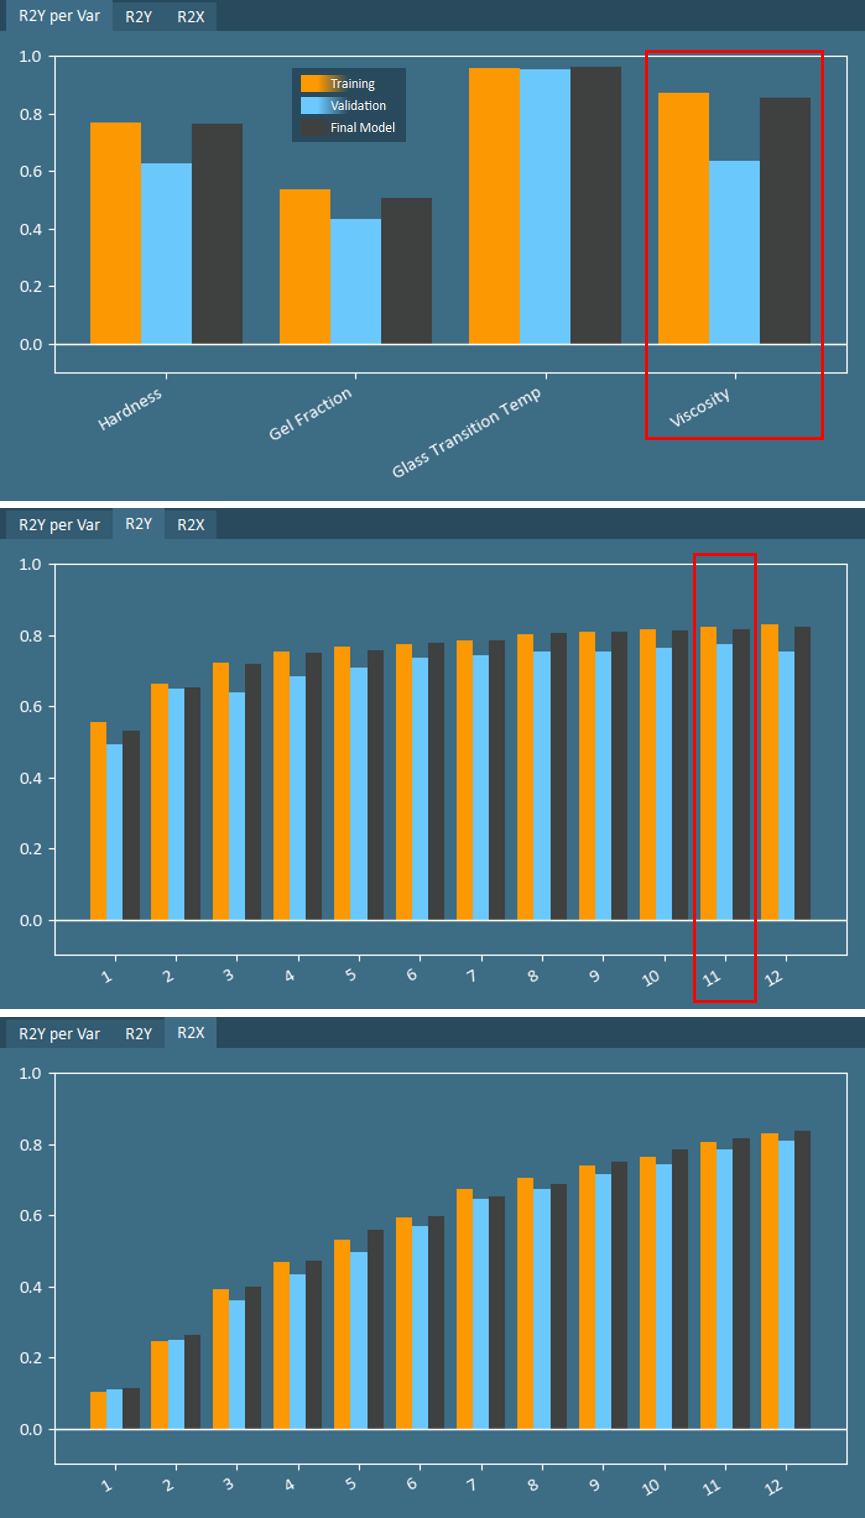 The R2X and R2Y plots indicate how well the components cumulatively describe variation in X- and Y-data, respectively. In addition, the R2Y per Var plot shows the model fit for each Y-variable using all components.
Much like the relationship between RMSEE and RMSEP, a well-fit model will result in similar values for R2 on training data as on validation data. Large differences in R2 indicate that further tuning of the number of components may be required. In the case of the coatings data, a model with 12 components was built. R2 for three of the four quality variables is relatively well-matched for training and validation groups, with the discrepancy in Viscosity indicating some possible overfitting.
While the cumulative R2 on training data will always increase with additional components, R2 on validation data will typically peak at some point and then begin declining. In the coatings example, R2Y on validation data peaks at 11 components, therefore one component should be removed from this model.
In some cases, such as when only 1 quality property is being predicted, model tuning may be as simple as using the provided + and – buttons in the Modeling Analysis to adjust the number of components on an existing model. However, in more complex cases, it may be wise to return to Modeling Setup to configure multiple and generate multiple models. With multiple models generated, the Model Info and Comparison table becomes a valuable tool for comparing configurations as well as model fit/performance.
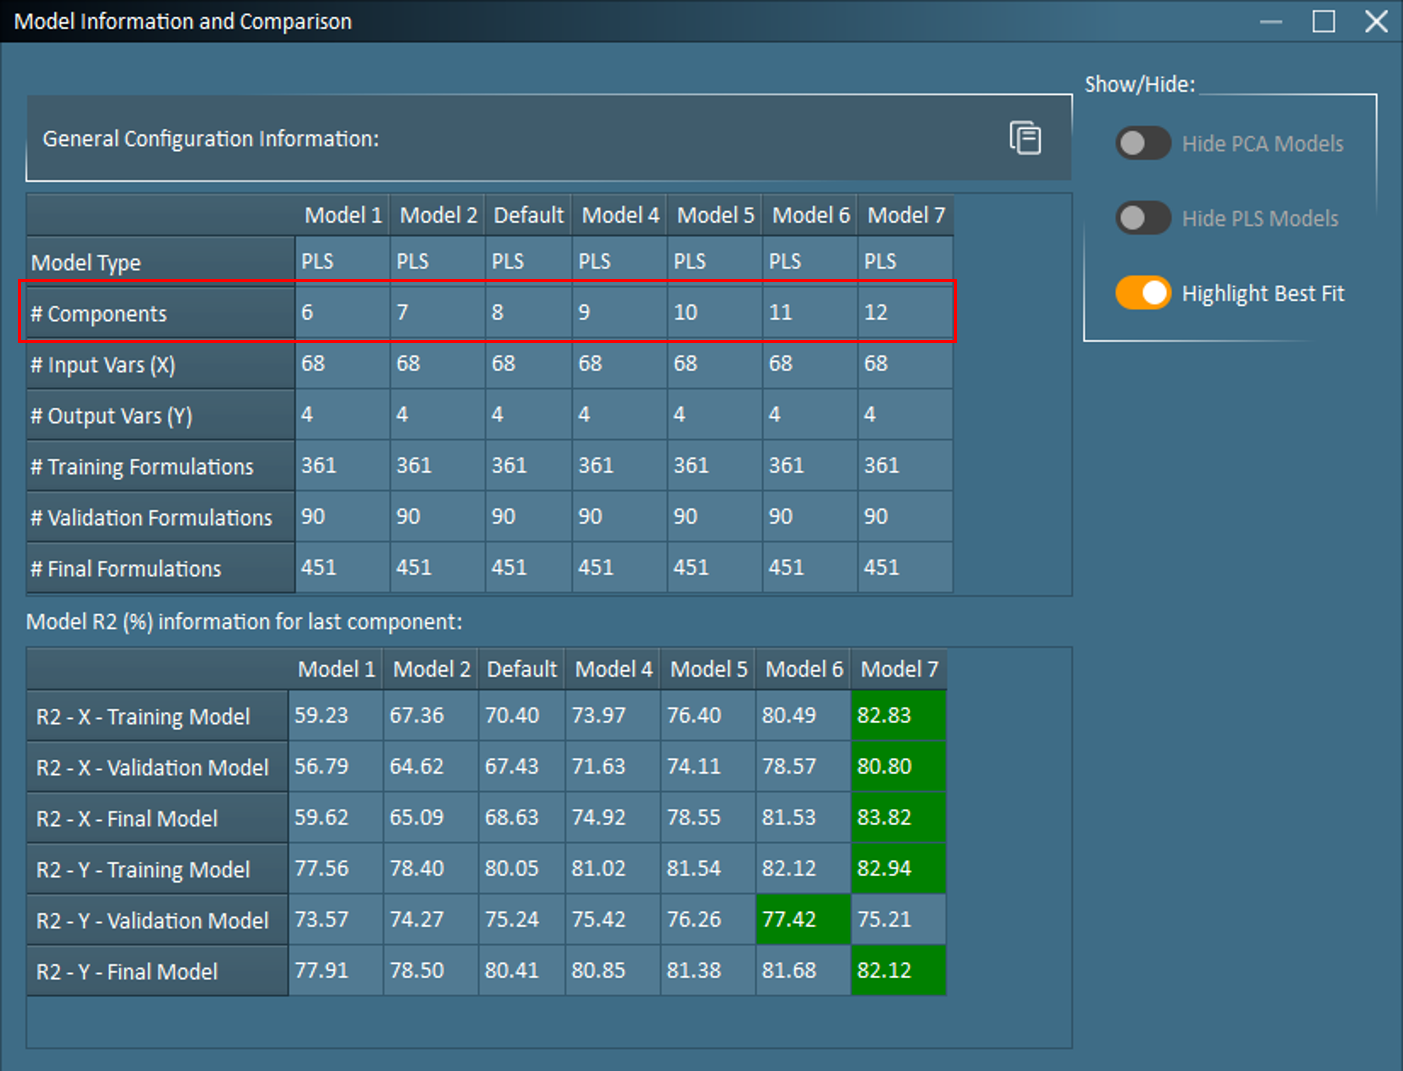
Based on the number of X and Y variables in the coatings dataset, the FormuSense default is 8 components. As seen in the Model Info and Comparison, 6 additional models were configured to explore the effect of tuning the model with a range 6-12 components. The Model R2 table indicates that R2Y – Validation Model peaks at 11 components (Model 6), therefore, Model 7 will be deleted before re-examining these results.
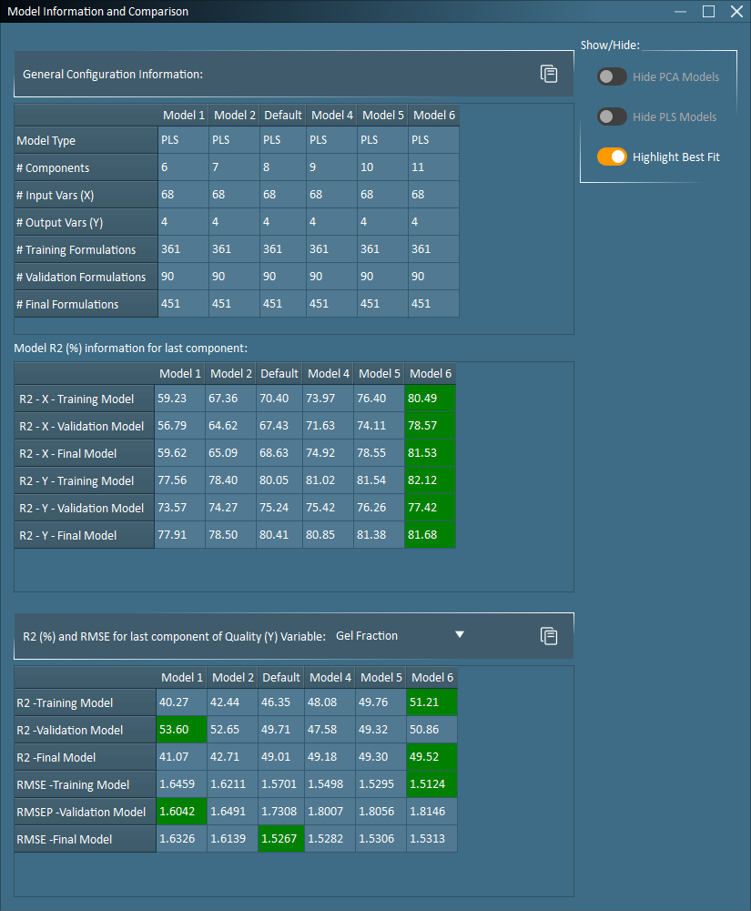 With Model 6 (11 components) identified as the best model fit, in terms of overall performance on validation data, it is also diligent to examine the model performance for each quality variable separately since it is rare for the same number of components to best fit all quality variables. User discretion, such as information on which quality variables are more important or contain more accurate data, may be needed to evaluate how many components should be selected for the final model. In the coatings example, the model performance on predicting Gel Fraction on unseen (validation) data worsens with each added component. Therefore, if Gel Fraction is the most important property to accurately predict, one should consider reducing the number of components in the model to a value lower than 11. The user should also use their knowledge on the number of degrees of freedom and amount of noise in the system to finalize the number of components.
Sanity Check from Subject-Matter Experts
Beyond model validation with a test/train split, another critical task is verifying modeling results with subject-matter experts (SMEs).
 A Coefficients Plot is an excellent resource for efficiently presenting results to an SME. Coefficients identify the simultaneous and directional impact of each X-variable on a specific Y-variable. The highest Y-values will occur when variables with positive coefficients are higher than average and when variables with negative coefficients are simultaneously lower than average.
For example, in the coatings model, an SME would quickly agree that the Glass Transition Temperature of the resin ingredients (RES_Tg – the largest positive coefficient below) is indeed expected to be strongly and positively correlated to the final product Glass Transition Temperature.
Applying the Model
Model tuning and model validation are important steps that should not be bypassed. Only after the Training/Validation model has undergone scrutiny and fine-tuning does it become appropriate proceed in FormuSense to the available Plot dropdown to view results for the Final Model (which uses both the training and validation groups together as training data), and to begin using the Final Model for simulation and optimization.