
Research and development activities are a pillar to the rubber industry; with such a large and competitive global market and a breadth of applications, manufacturers are continually striving to create new, improved, cheaper or more sustainable rubber products (such as industrial seals, tires, and tire sidewalls).
Over the years, ProSensus has attended numerous events hosted by the Rubber Division of the American Chemical Society including their Spring Technical Meeting and International Elastomer Conference, and we get a monthly dose of industry news by reading RubberWorld Magazine. Through this exposure, we have observed commonalities in how product development research is conducted and presented in this industry.
There is an opportunity for the rubber industry to improve R&D workflows, empowering formulators to conduct fewer but more meaningful experiments, to ultimately accelerate innovation.
Workflow Typical to Rubber Industry
- An existing compound is selected as the “control” sample
- A replacement material, or an additional ingredient is added to the compound
- As little as 2 experiments are performed
- The resulting quality is compared using a variety of plots and tables
This above workflow is a “start from scratch” approach that does NOT incorporate past learnings from previous similar experiments in a quantitative way, and does NOT include valuable raw material property data.
However, domain experts in the rubber industry have been successfully conducting research in this way for many years, so why reinvent the wheel? Recent advancements in areas from data acquisition to advanced analytics have paved the way for faster innovation than ever before. Predictive modeling is the cornerstone of new R&D workflows, where formulators can build and interpret models to simulate and optimize ingredient selection and expected product quality to guide physical experimentation.
Workflow Recommended by ProSensus
- Collect data from as many relevant historical formulations as possible – this can range from a handful of experiments to over 1000 experiments
- Where available, include raw material properties on key ingredient classes – this is especially important if you wish to explore new ingredients within an ingredient class (resins, EPDM, etc.)
- Build and validate predictive models using FormuSense
- Simulate new experiments – provide ingredients as model inputs and FormuSense will predict quality. Perform only those experiments that fall outside the model’s validity metrics.
- Optimize new experiments – provide target quality as model inputs and FormuSense will use numerical optimization to identify what ingredients and process conditions should be used. Sometimes a few iterations are required to reach targeted quality. This will result in targeted experimentation to stretch the dataset and re-model.
This methodology can apply to both large and small datasets.
This dataset includes 9 compounds, or experiments, that were run with varied amounts of graphene (also called Prophene), TMQ, and 6PPD. ProSensus imported this published dataset to FormuSense where we then built predictive models. Selected modeling results and potential additional experiments are shown.
If you are interested in how this framework can be applied to a larger dataset in this industry, and where raw material properties are also available, see Mitsibushi.
The dataset
The compound formulations for the 9 historical dataset are shown below.1 Many quality variables were evaluated when the experiments were performed, however, ProSensus selected 4 quality variables for modeling which are also shown below.1
| Ingredient Name | 1 | 2 | 3 | 4 | 5 | 6 | 7 | 8 | 9 |
|---|---|---|---|---|---|---|---|---|---|
| Natural Rubber | 50 | 50 | 50 | 50 | 50 | 50 | 50 | 50 | 50 |
| Polybutdiene | 50 | 50 | 50 | 50 | 50 | 50 | 50 | 50 | 50 |
| Prophene | 0 | 0 | 0.5 | 1 | 4 | 7 | 10 | 4.5 | 4.5 |
| Carbon Black | 45 | 45 | 45 | 45 | 45 | 45 | 45 | 45 | 45 |
| Process Oil | 3.5 | 3.5 | 3.5 | 3.5 | 3.5 | 3.5 | 3.5 | 3.5 | 3.5 |
| Paraffin wax | 2 | 2 | 2 | 2 | 2 | 2 | 2 | 2 | 2 |
| Microcyrstalline wax | 1 | 1 | 1 | 1 | 1 | 1 | 1 | 1 | 1 |
| Tackifying resin | 2 | 2 | 2 | 2 | 2 | 2 | 2 | 2 | 2 |
| TMQ | 1.5 | 0 | 0 | 0 | 0 | 0 | 0 | 1.5 | 1.5 |
| 6PPD | 4.5 | 0 | 0 | 0 | 0 | 0 | 0 | 4.5 | 0 |
| Zinc Oxide | 1 | 1 | 1 | 1 | 1 | 1 | 1 | 1 | 1 |
| Stearic acid | 1 | 1 | 1 | 1 | 1 | 1 | 1 | 1 | 1 |
| TBBS | 1 | 1 | 1 | 1 | 1 | 1 | 1 | 1 | 1 |
| Sulfur | 1 | 1 | 1 | 1 | 1 | 1 | 1 | 1 | 1 |
| Retarder | 0.25 | 0.25 | 0.25 | 0.25 | 0.25 | 0.25 | 0.25 | 0.25 | 0.25 |
| Total phr | 163.75 | 157.75 | 158.25 | 158.75 | 161.75 | 164.75 | 167.75 | 168.25 | 163.75 |
| Formulation | Tensile Strength | Tear Strength | Rating | 3-Day Ozone Aging Elongation |
|---|---|---|---|---|
| 1 | 23.03 | 120 | 100 | 710 |
| 2 | 23.45 | 123 | 93.38 | 518 |
| 3 | 22.84 | 124 | 95.98 | 505 |
| 4 | 23.21 | 119 | 91.2 | 502 |
| 5 | 23.8 | 112 | 79.5 | 483 |
| 6 | 23.56 | 102 | 65.34 | 472 |
| 7 | 22.58 | 103 | 61.71 | 508 |
| 8 | 23.82 | 111 | 72.27 | 699 |
| 9 | 24.55 | 115 | 78.2 | 558 |
Handling non-linearity
As described in the RubberWorld article, and as seen in the data, there is an initial increase in tear strength when low amounts of prophene are added (experiment 3), with a decline seen with higher amounts (experiments 4 – 7). There is also a similar relationship between the amount of prophene added and tensile strength.
In order to model this effect, several categories for prophene amounts were established and categorical variables were created (0/1) if an experiment contained prophene in those levels. The levels were based on the overall percentage of prophene in the formulation being in the following categories:
- Prophene = 0%
- 0% < Prophene < 0.4%
- 0.4% <= Prophene < 2.5%
- 2.5% <= Prophene < 3%
- Prophene >= 3%
Another method to handle non-linearities could be to add variable transformations. In this case, we have also added (Prophene ratio)^2 and (Prophene ratio)^3 as input variables for the model.
Modeling
Using the 9 experiments, a PLS model can be developed to fit the variation in the 4 quality variables. For the input variables, ProSensus used the 5 categorical variables, the total loading (amount of ingredients), the two transformation variables, and the ingredient ratios as a percentage.

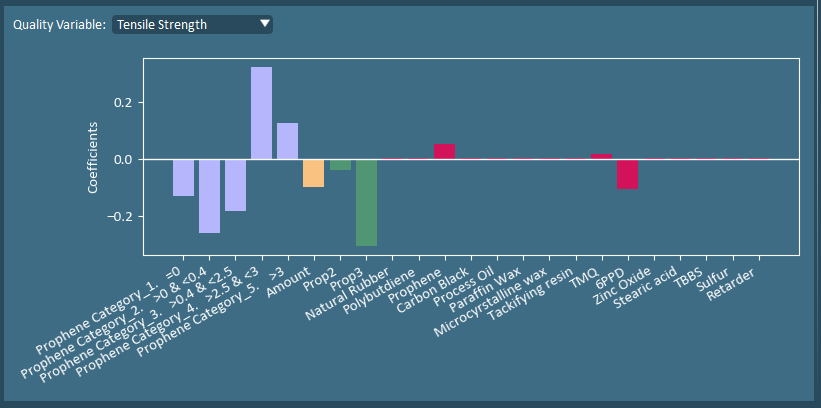
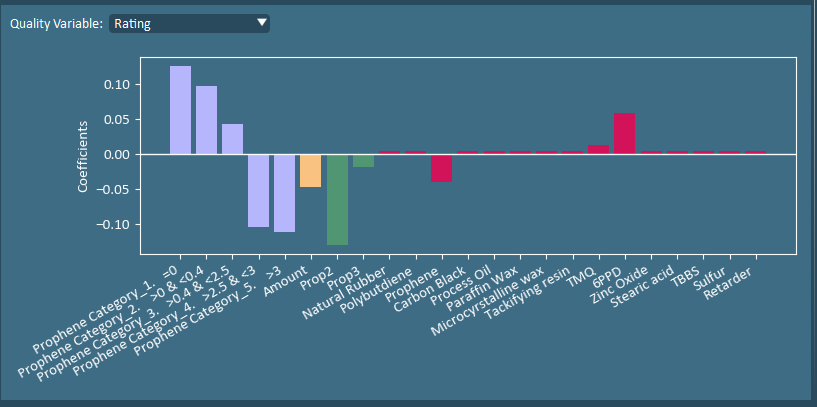
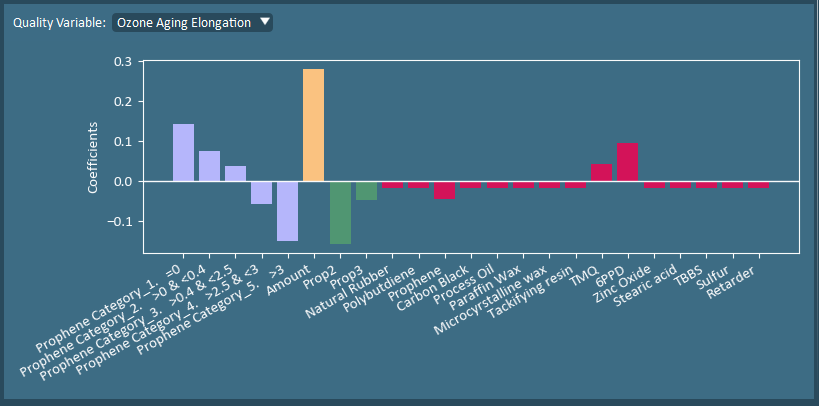
The PLS model generates coefficients that we can analyze, and are shown here for Tensile Strength, Tear Strength, Rating, and 3-Day Ozone Aging Elongation.

Model interpretation
The model coefficients show the simultaneous impact of all the input variables to the specific quality variable. In this dataset, the goal is to maximize all of these metrics. However, from the coefficient plots we see that maximizing tensile strength would require prophene to be between 2.5-3% and lower than average 6PPD, while the other 3 properties are maximized when minimal prophene is added with more than average 6PPD.
Recommended additional experiment using numerical optimization
Constrained, numerical optimization can be used to find a new experiment(s) that are predicted to result in a targeted quality. In this case, the objective function is set to maximize all 4 quality properties, with an increased importance set on maximizing the tensile strength. Additionally, the multivariate validity metrics of SPE and Hoteling’s T2 must be within the model’s 99% confidence interval to avoid extensive extrapolation.
The resulting optimal formulation and predicted quality properties are shown in the following two tables.
| Ingredient Name | 1 (Control) | 2 | 3 | 4 | 5 | 6 | 7 | 8 | 9 | Opt |
|---|---|---|---|---|---|---|---|---|---|---|
| Natural Rubber | 50 | 50 | 50 | 50 | 50 | 50 | 50 | 50 | 50 | 50 |
| Polybutdiene | 50 | 50 | 50 | 50 | 50 | 50 | 50 | 50 | 50 | 50 |
| Prophene | 0 | 0 | 0.5 | 1 | 4 | 7 | 10 | 4.5 | 4.5 | 4.15 |
| Carbon Black | 45 | 45 | 45 | 45 | 45 | 45 | 45 | 45 | 45 | 45 |
| Process Oil | 3.5 | 3.5 | 3.5 | 3.5 | 3.5 | 3.5 | 3.5 | 3.5 | 3.5 | 3.5 |
| Paraffin wax | 2 | 2 | 2 | 2 | 2 | 2 | 2 | 2 | 2 | 2 |
| Microcyrstalline wax | 1 | 1 | 1 | 1 | 1 | 1 | 1 | 1 | 1 | 1 |
| Tackifying resin | 2 | 2 | 2 | 2 | 2 | 2 | 2 | 2 | 2 | 2 |
| TMQ | 1.5 | 0 | 0 | 0 | 0 | 0 | 0 | 1.5 | 1.5 | 1.5 |
| 6PPD | 4.5 | 0 | 0 | 0 | 0 | 0 | 0 | 4.5 | 0 | 2.21 |
| Zinc Oxide | 1 | 1 | 1 | 1 | 1 | 1 | 1 | 1 | 1 | 1 |
| Stearic acid | 1 | 1 | 1 | 1 | 1 | 1 | 1 | 1 | 1 | 1 |
| TBBS | 1 | 1 | 1 | 1 | 1 | 1 | 1 | 1 | 1 | 1 |
| Sulfur | 1 | 1 | 1 | 1 | 1 | 1 | 1 | 1 | 1 | 1 |
| Retarder | 0.25 | 0.25 | 0.25 | 0.25 | 0.25 | 0.25 | 0.25 | 0.25 | 0.25 | 0.25 |
| Formulation | Tensile Strength | Tear Strength | Rating | 3-Day Ozone Aging Elongation |
|---|---|---|---|---|
| 1 (Control) | 23.03 | 120 | 100 | 710 |
| 2 | 23.45 | 123 | 93.38 | 518 |
| 3 | 22.84 | 124 | 95.98 | 505 |
| 4 | 23.21 | 119 | 91.2 | 502 |
| 5 | 23.8 | 112 | 79.5 | 483 |
| 6 | 23.56 | 102 | 65.34 | 472 |
| 7 | 22.58 | 103 | 61.71 | 508 |
| 8 | 23.82 | 111 | 72.27 | 699 |
| 9 | 24.55 | 115 | 78.2 | 558 |
| Predicted Optimal | 24.22 | 113 | 79 | 625 |
Converting the optimized formulation (in above table) from phr to percentage results in 2.5% prophene, while 6PPD is used at a lower amount than previous formulations.
The resulting predicted properties are shown below in mean centered and scaled units. A value of 0 means the property is at the dataset average, while a value of +2 would be 2 standard deviations greater than the average.
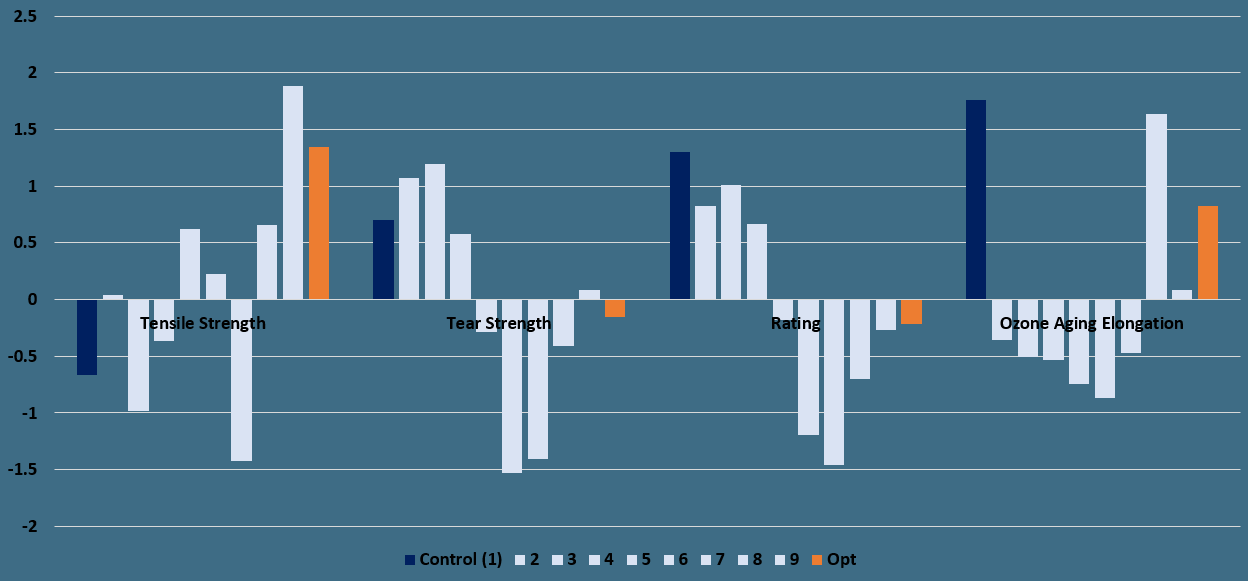 As shown in the above bar plot, the resulting optimal formulation would result in much higher-than-average tensile strength than the control, but near-average Tear Strength and Rating, and higher-than-average 3-day ozone elongation.
Getting started
In order to get started, download a FormuSense trial. We will send you some published datasets as well as a tutorial to help you get started using the software. We strongly believe that an improved workflow and faster innovation can be achieved by applying advanced analytics to the rubber industry.
References
- Tire compounding with graphene: The tire sidewall. Doug Paschall, Adel Halasa and Brendan Rodgers, Akron Polymer Solutions. September 20, 2022. RubberWorld. Volume 266, No.6.