Ratios
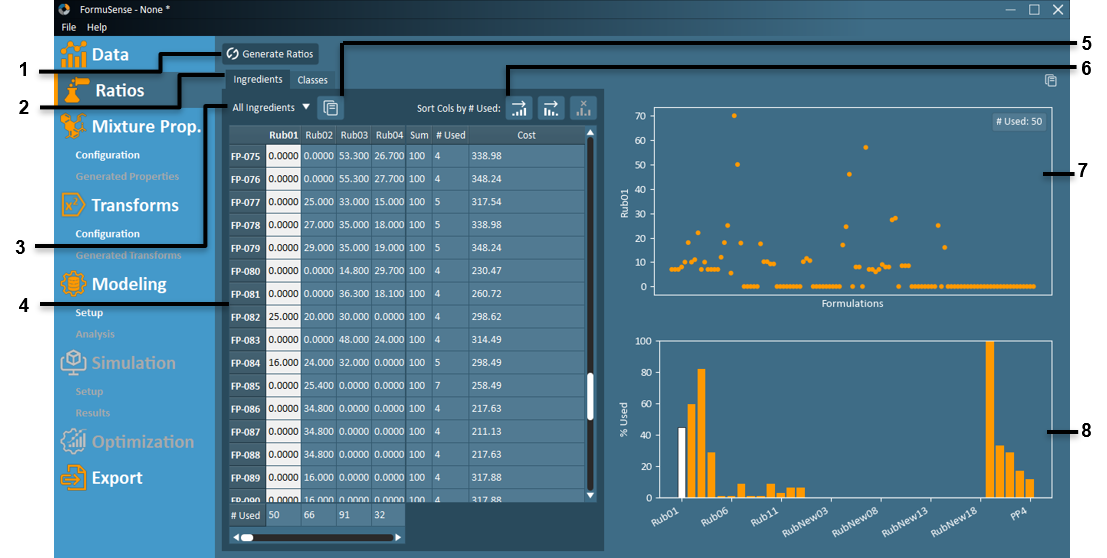
Generate Ratios – Using data from the Data Import stage, formulations are converted into table form using the options selected during import (fraction, percent, or quantity); See Ratio Derivations for information on ingredient ratio calculations.
Ingredients – View the ingredient ratios table.
Ingredient Class Dropdown – The ratio table can be displayed with all ingredients, or per ingredient class.
Ratio Data – The ingredient ratio data is displayed here.
Formulations are listed in the rows.
Ingredients are listed in the columns.
The data shown is dependent on the import option selected (see Import Example).
Any ingredients that a particular formulation does not use will appear as a 0.
The number of times an ingredient is used across all formulations is displayed as the last row at the bottom of the table (“# Used”).
The total sum of ingredient amounts for each formulation is listed on the right in terms of percentage. Ratios imported as fractions will be converted to percentages (multiplied by 100).
Note
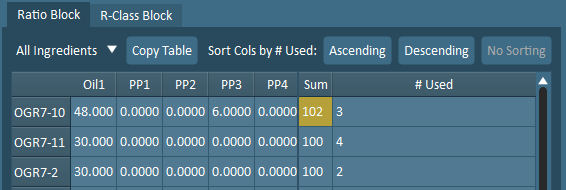
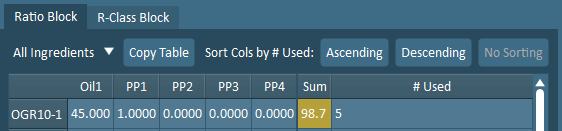
The cells in this column will be highlighted in yellow if the formulation violates the sum rule (i.e. the total percentage does not sum to 100%). If ratios are imported as amount, then FormuSense automatically converts to percentages (with total amount as the basis) and all formulations will sum to 100.
The following shows a percentage example of a formulation exceeding 100:
The following shows a percentage example of a formulation not meeting the 100 requirement:
The number of unique ingredients that each formulation uses is listed (”# used”) on the far right of the table.
The sum of ingredient costs for all ingredients currently displayed in the ratios table is included as the last column for each historical formulation.
Copy Table – Copy the current displayed table to the clipboard.
Table Sort – The ratio table can be sorted in ascending or descending order by number of times the ingredients are used (displayed at the bottom of the table as # Used).
Ingredient Usage Plot – A plot of the selected column data is displayed with:
The X axis representing each formulation in order of the table.
The Y axis representing the amount of the ingredient used in each formulation.
The number of times the ingredient is used across all formulations is displayed at the top-right of the plot.
Ingredient Usage Histogram – A histogram of the ratio table is displayed, with the current ingredient selected highlighted in blue. The histogram will display the ingredients in the active table (based on the Ingredient Class Dropdown selected).
The X axis lists each ingredient.
The Y axis displays the number of times each ingredient is used across all formulations.
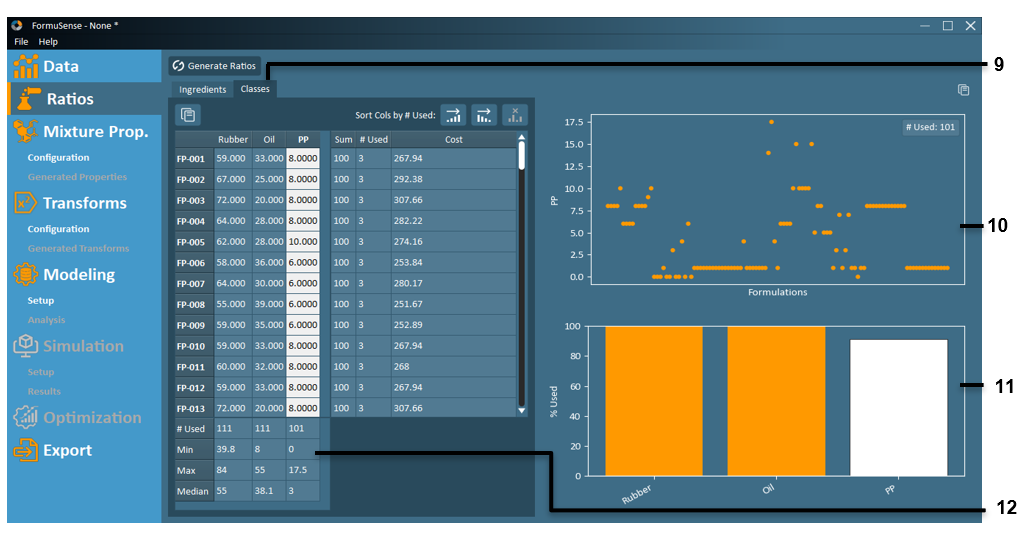
Classes – View the class ratios table. Below, the ingredient class data is displayed here. Similar to the ratio table, the formulations are listed as rows. The columns list the total sum of each class for each formulation.
The number of times a class is used across all formulations is displayed at the bottom of the table.
The minimum, maximum, and median amount of each class across all formulations is displayed at the bottom of the table.
The total sum of classes of each formulation is listed on the right. The cells in this column may be highlighted in yellow if there is an anomaly (e.g. if the total percentage does not sum to 100%).
The number of classes that each formulation uses is listed on the far right of the table.
The sum of ingredient costs for each formulation is included as the last column in the ratios table.
Ingredient Class Usage Plot – A plot of the selected column data is displayed with:
The X axis representing each formulation in order of the table.
The Y axis representing the amount of the class used in each formulation.
The number of times the class is used across all formulations is displayed at the top-right of the plot.
Ingredient Class Usage Histogram – A histogram of the ratio table is displayed, with the current class selected highlighted in blue.
The X axis lists each class.
The Y axis displays the number of times each class is used across all formulations
Class Statistics – Basic statistical information regarding the class (column). This includes the number of times the class is used, and the minimum, maximum, and median values of the column.