Mixture Properties
Configuration
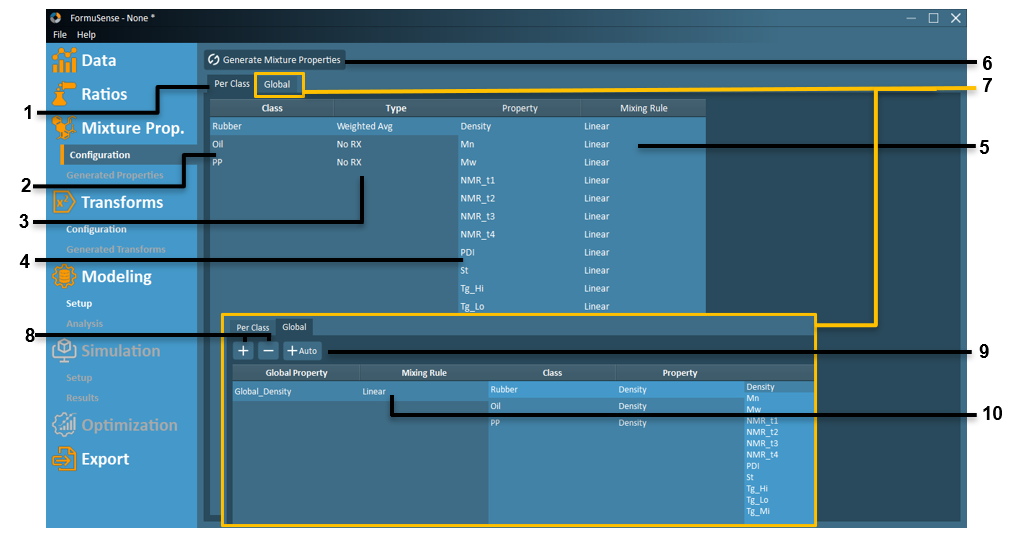
Per Class – View the mixture property configuration for each ingredient class.
Class – All classes in the dataset are listed in this column and can be selected here.
Type – For each class, the type of calculation used for the mixture properties can be selected. The properties can be calculated using an additive rule, weighted average rule, or the user can elect to not calculate mixture properties for the class. See Mixture Properties (RX) Derivations for further details on mixture properties.
Property – All properties contained in the selected class are listed in this column.
Mixing Rule – For each listed property, a mixing rule transformation can be selected. The user may select from one of the following transformations: linear, logarithmic, or natural logarithm. See Mixture Properties (RX) Derivations for further details on property transformations.
Generate Mixture Properties – Using the configurations selected by the user, the mixture properties are calculated using the ratios generated in the previous stage and the imported properties. Results may be viewed and analyzed in Generated Properties.
Global – View, add, and edit global properties.

 – Create a new global property or remove a global property.
The following prompt will appear to name the new global property:

+Auto – When this feature is selected, FormuSense will automatically generate a global mixture property for each ingredient property that appears across all ingredient classes (with the exact same nomenclature). After +Auto completes its configuration, users may adjust the name of the global property (default is “Global_Ingredient Property Name”, the mixing rule (default is Linear) and which ingredient property has been selected from each ingredient class.
Global Property
Once a global property has been created, a Mixing Rule may be selected (linear, logarithmic, natural logarithm) for this property.
All ingredient classes will be listed under Class. Once a class is selected, the list of properties available to be selected for the class will appear to the right of the Property column. The selected property will then appear under the Property column. (Refer to Mixture Properties (RX) Derivations for information on Global Properties.)
Generated Properties
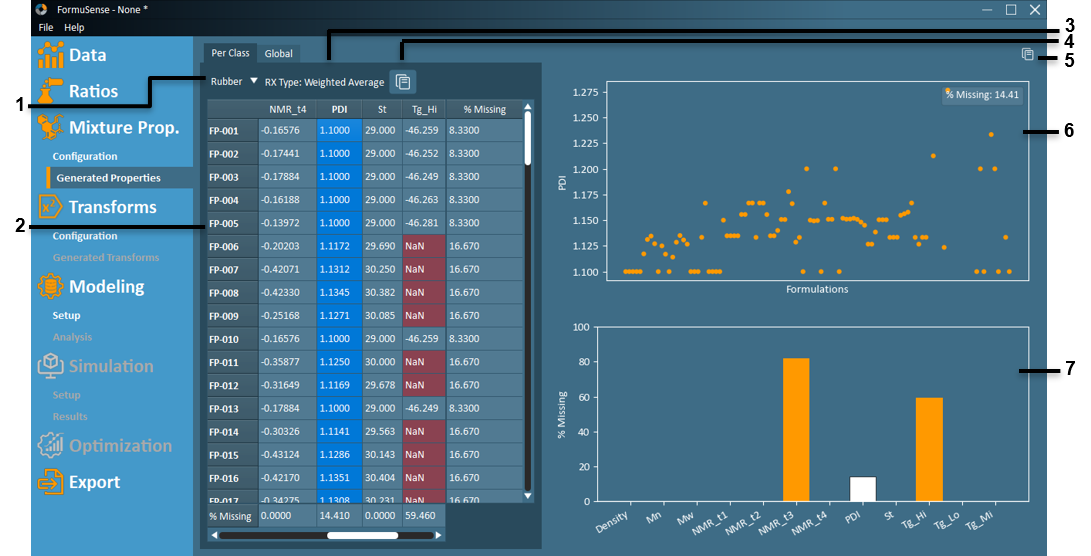
Class Dropdown – View the mixture property results for the selected class.
Mixture Property Results – The results of the mixture property calculations are displayed here. If a cell is selected, the entire column will be highlighted and the property plot will be populated. At the bottom of each column (variable/property) and the end of each row (formulation) displays the total percentage of data missing (NaN).
RX Type – The property calculation type selected in the configuration is shown here for the selected class. The RX (Mixture Property) Type may be additive, weighted average, or none.
Copy Table – Copy the current displayed table to the clipboard.
Copy Plots – Copy the current displayed plots to the clipboard.
Property Plot – A plot of the selected column data is displayed with:
The X axis representing each formulation in order of the table.
The Y axis representing the property value of the corresponding formulation.
The percentage of missing data across all formulations for the selected property is displayed at the top-right of the plot.
Missing Data Histogram – A histogram of the percentages of missing data for all properties is displayed, with the current property selected highlighted in blue.
The X axis lists each property/variable.
The Y axis displays the percentage of missing data across all formulations.