Simulation
Important
Simulation setup is highly dependent upon the model type and model structure. If a user configures and generates simulation scenarios, then proceeds to make changes from within any of the earlier navigation screens (Data, Ratios, Mixture Prop., Modeling) then all simulation configurations and results will be erased.
Setup
Simulation setup allows the user to provide a value for each input (X) variable for the selected model. Depending on the model type (PCA or PLS) and structure (variables included or excluded), simulation setup features #10-18 may or may not be available to the user.
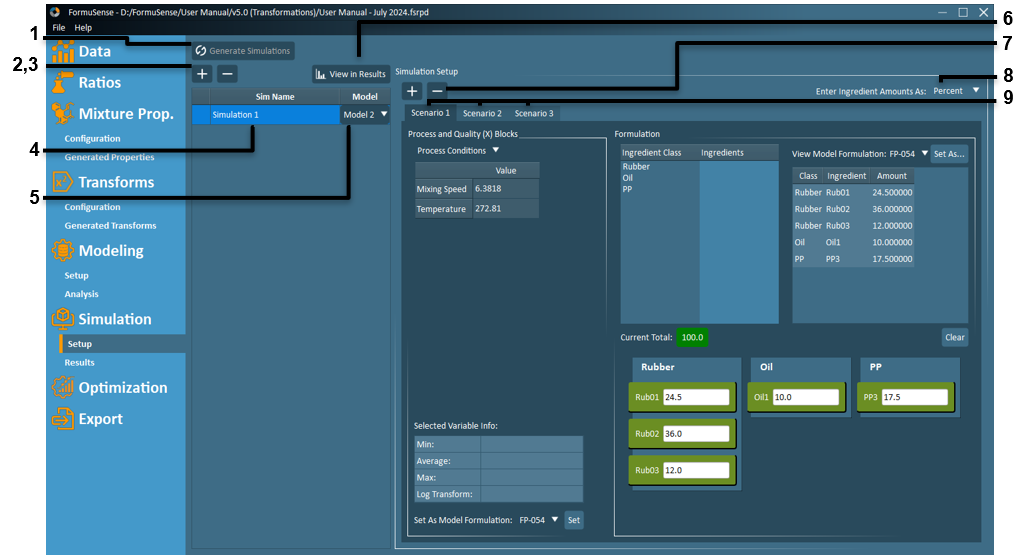
Generate Simulations – Generate all simulations and scenarios listed and configured in the Simulation Setup.
 – Create a new simulation.
 – Delete an existing simulation.
Simulation Listing – All existing simulations are listed here along with the desired PLS model. Simulations can be renamed by double-clicking the “Sim Name” field. Right-clicking on a simulation in this list allows users to create a new simulation using the existing configuration as the basis.
Model Selection – The selected PLS model can be adjusted by using the provided drop-down in the “Model” field.
View in Results – After simulations have been generated, click “View in Results” to switch from Simulation Setup view to Simulation Results view.
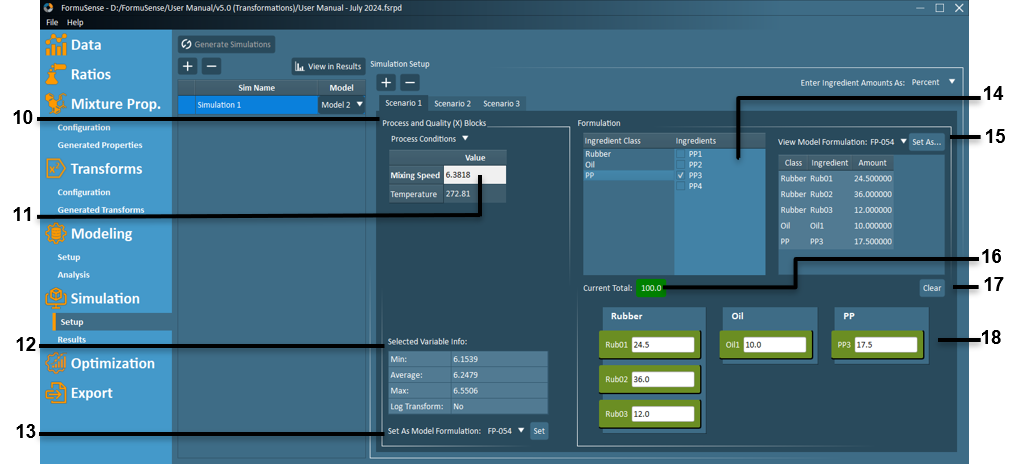
- – Create a new scenario or delete an existing scenario.
Enter Ingredient Amount As – Select the measurement units (fraction, percent, or quantity) for specifying formulation ingredients for all scenarios within one simulation.
Note
The amount type is locked to Quantity if the user used Quantity amount type when importing the dataset and the auto-generated Quantities block is included in the selected model.
Scenario Selection – View configuration for an individual scenario. Right-click on any scenario to rename the scenario, create a new scenario from the existing scenario, or delete the scenario.
Process and Quality (X) Blocks – Switch between blocks of process condition variables and, for PCA models, any blocks of quality variables.
Important
While blocks of quality variables included in a PLS model are automatically designated to separate outcome (Y) blocks, any blocks of quality variables included in a PCA model are treated as input (X) blocks by FormuSense and accessed in Simulation setup as separate process condition blocks.
Process Conditions and Quality (X) Value – Double-click on the Value field for any process condition or quality (X) variable to specify or edit the value.
Note
By default, all variables in this simulation setup are set to the model average.
Important
The model structure dictates whether process values and quality (X) values can be added to a formulation scenario.
Selected Variable Info – Click on the name of any variable in the this table to view useful metrics about that variable in the “Selected Variable Info” table. The metrics in this table are calculated from historical formulations used in the selected model.
Set As Model Formulation – This dropdown feature allows the user to set all variable values based on a historical formulation from the current model. After selecting a historical formulation, click “Set” to apply these values.
Formulation Class & Ingredient Selection – Select ingredient classes and/or individual ingredients to add to the formulation scenario using the available checkboxes.
Note
By default, new scenarios begin with no ingredients or classes selected.
Important
The model structure dictates whether ingredient information (either as individual ingredient amounts or as overall ingredient class amounts) can be added to a formulation scenario. In other words:
If the model includes the ratio block, only ingredients used in model formulations can be selected for classes.
Any ingredient (previously used or new) can be selected for classes that include mixture properties (global or for the class) in the model or have variability in cost, and do not include the ratio block in the model.
Only “class amount” can be specified for classes where mixture properties and ratio blocks are not included in the model, and if there is no variation in ingredient costs within the class.
View Model Formulation – This dropdown feature allows the user to view the ingredient selections and ingredient amounts for any historical formulation in the model. While viewing any particular model formulation, click “Set As…” to set the scenario ingredient selections and amounts to match that model formulation.
Current Total – The sum of all ingredient amounts.
Important
For simulations that have ingredient amounts specified as either Percent or Fraction, simulations cannot be generated until the current total equals 100% or 1.0 respectively, and is therefore colored green.
Clear – Clear all ingredient selections and ingredient amounts for the active scenario.
Active Ingredients Amounts – All ingredients that have been selected in the Formulation Ingredient Selection (see feature #14) or by the “Set As…” feature will appear in the active ingredients amounts. Click on any ingredient to specify or edit the amount to be used in the scenario.
Note
By default, when a new ingredient or class is selected in the Formulation Class & Ingredient Selection (see feature #14), the amount is set to 0.
Results
Depending on the model type (PCA or PLS) and structure (variables included or excluded), simulation result features #3-5 may or may not be available to the user.
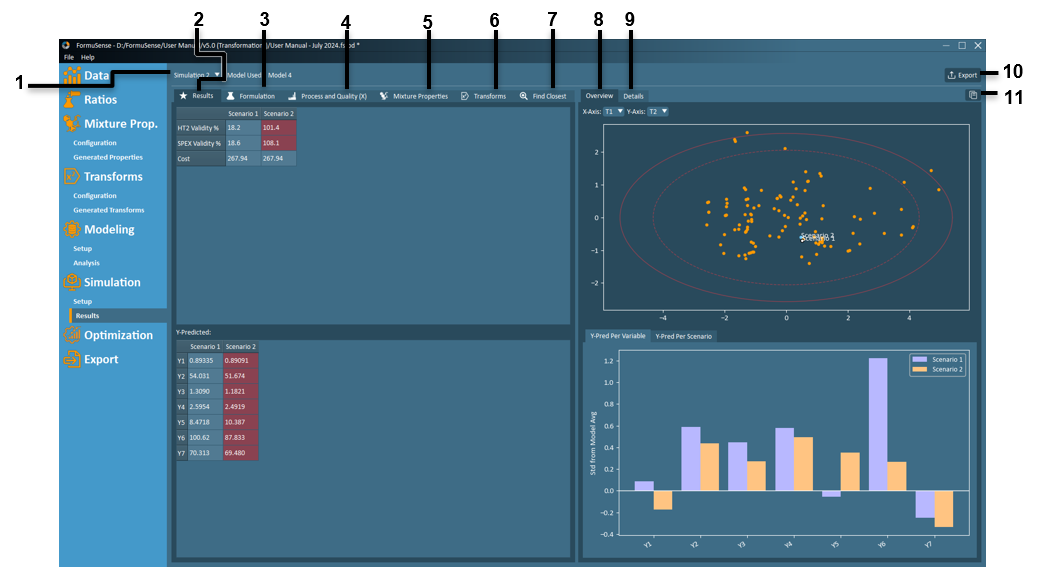
Simulation Selection – Switch between viewing results for different simulations using this dropdown.
Results – Tabular summary of simulation results including: model validity metrics (HT2 & SPE), formulation cost, and predicted quality. Click on the column header for a scenario of interest to colour that scenario white on the score plot found in the Simulation Results Overview.
Important
Simulations that violate either the HT2 or SPE model validity metric (≥100% of limit) are identified by red coloured cells. A violation of either limit indicates that the model is extrapolating beyond the design space provided by the historical training data, therefore any violations are coloured red and results should be interpreted with caution.
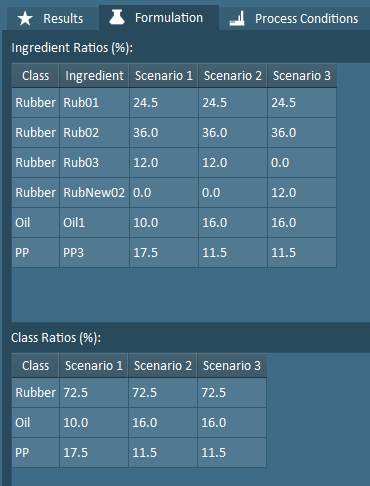
Formulation – Tabular summary of the ingredient selections and ratios specified for all scenarios in Simulation Setup.
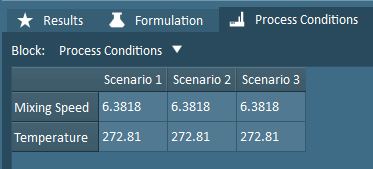
Process and Quality (X) – Tabular summary of the process conditions and any quality variables specified as inputs for all scenarios in Simulation Setup. Separate blocks of process conditions and/or quality variables are accessed with the Block dropdown.
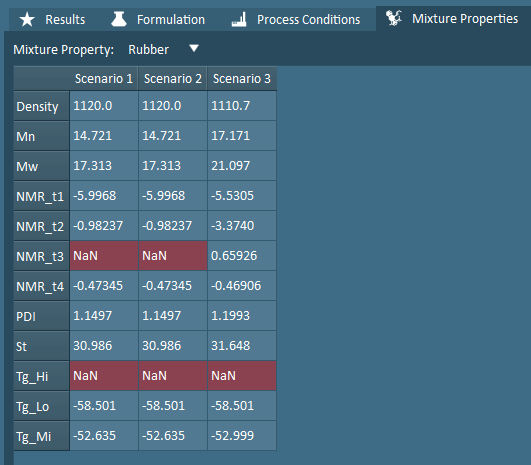
Mixture Properties – Tabular summary of the mixture properties for all scenarios, resultant of the ingredient selections and ratios specified in the Simulation Setup and the Mixture Property Configuration. Class ingredient properties and global properties are accessed with the Mixture Property dropdown.
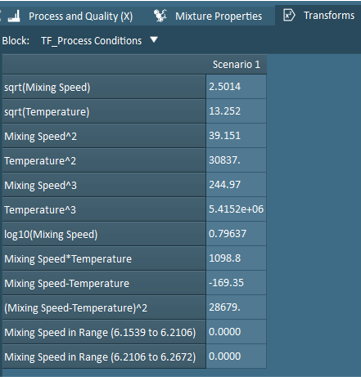
Transforms – Tabular summary of the data transforms for all scenarios, resultant of the Simulation Setup. Separate blocks of transforms are accessed with the Block dropdown.
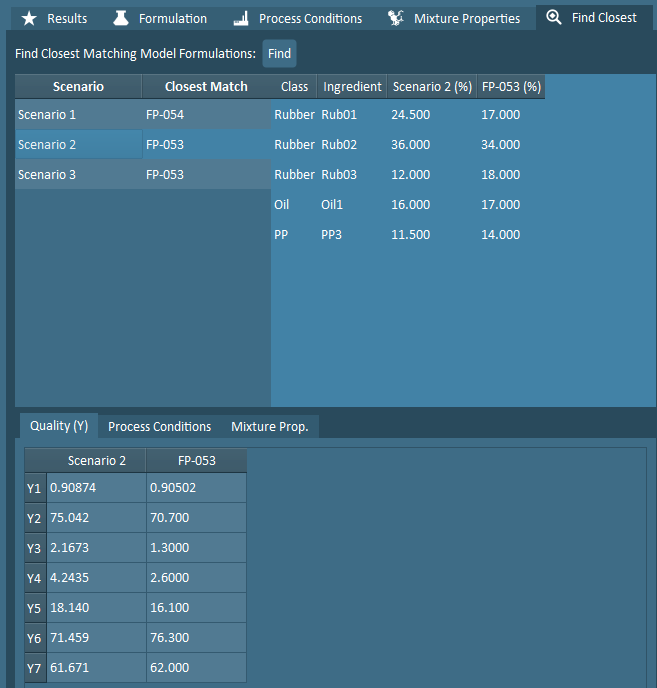
Find Closest – Tabular comparison of each scenario and the historical formulation that most closely matches the simulation.
When the Find button is clicked and a scenario is selected in the resulting table, that scenario and its closest matching formulation are both identified in white on the score plot in the Simulation Results Overview. If the historical dataset includes repeats that cause Find Closest to have multiple results, the last formulation (from alphabetic order) will be selected as the closest-matching.
For more information about how the closest matching historical formulation is calculated, refer to Mathematical Derivations for Simulation.
Overview – Graphical summary of all scenarios, including a score plot and bar plot of quality predictions.
Score plot – The score plot shows how the simulation scenarios (blue) compare to the historical data (orange) included in the model. If desired, click-drag to zoom-in on a region of interest.
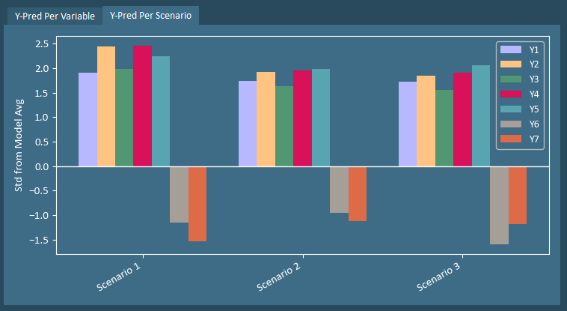
Y-Pred – Predicted quality, displayed as the number of standard deviations from the model average. This plot is only available for PLS models.
Per Variable – results grouped by Y-variable (default)
Per Scenario – results grouped by scenario
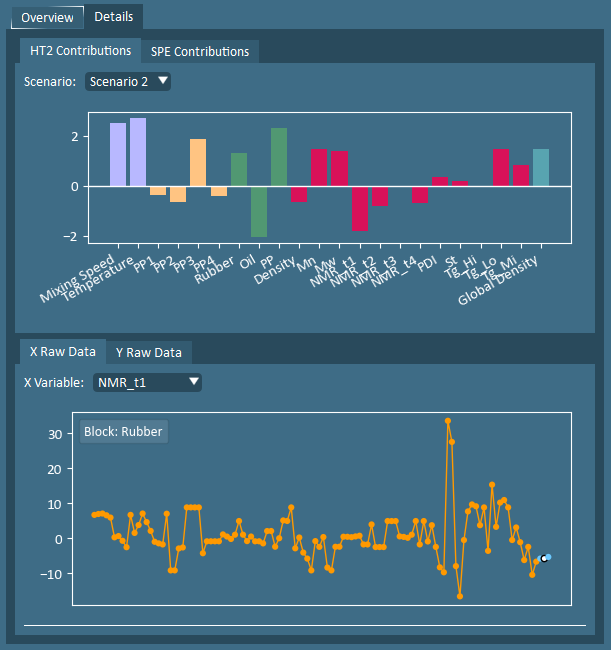
Details – Additional plots to aid interpretation of simulation results.
Contributions – HT2 (default) & SPE. These plots identify the variables that most significantly differ from the historical average to the selected simulation scenario. Use the provided dropdown, or click on the column header in any of the Simulation Results tables to view the contributions for a particular scenario.
Raw Data – X (default) & Y (only for PLS models). Line plots including historical formulations and simulation scenarios. Use the provided dropdown, or click on the row header in any of the Simulation Results tables to view a particular variable. Clicking on a column header in the Simulation Results tables will color the scenario white in the raw data plots.
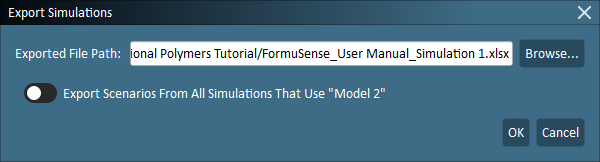
Export – Create an Excel file that includes all relevant variable blocks. Depending on the model type and structure, this may include the Formulations, Process Conditions (including any input quality variables for PCA models), and outcome Predicted Quality (for PLS models) for the current simulation. Use the provided toggle to export simulation results for all simulations that use the same Model as the active simulation.
Note
By default, the save file path is the project file path, with default file name being the “project name _simulation name”.
Copy – Copy current displayed plots to clipboard.