Export
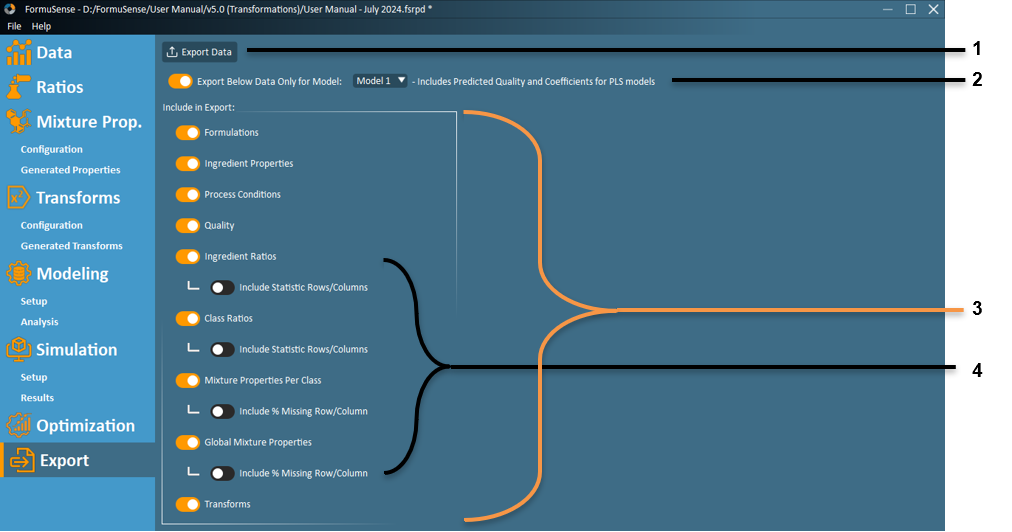
Export Data – Export the selected data to a Microsoft® Excel® file (.xlsx). When selected, a dialogue window will appear with a suggested a file name and location. The user may adjust the file name and location if desired.
Note
By default, the save file path is the project file path, with default file name being the project name. If the toggle is used to select a specific model (see feature #2), then the model name is appended to the export file name.
Export Model Data – When this toggle is off, all data in the block selections (see feature #3) are exported. When this toggle is on, and a specific model is selected from the dropdown, only data used in that particular model will be exported (i.e. formulations and variables removed during model setup will not be exported). In addition, for PLS models, the predicted quality and model coefficients are exported when this toggle is on.
Exported model coefficients can be used to predict quality (\(\widehat{Y}_{new}\)) using the following equation:
\[\widehat{Y}_{new} = \beta \cdot X_{new} + C\]Where,\(X_{new}\) is the new observation in original units\(\widehat{Y}_{new}\) is the predicted quality in original units\(\beta\) are the model coefficients\(C\) is a set of constants used to correct for scaling, and is exported along with the model coefficientsNote
Any Y variables that were transformed for the model training (set in the Modeling Setup) must be applied as an exponent to base 10 (i.e. \(10^{\widehat{Y}}\) for a logarithmic transform) to retrieve \(\widehat{Y}_{new}\) in original units. Additionally, any X variables that were transformed for the model training must be transformed prior to applying the above relationship (e.g. \(\log_{10} X_{new}\)).
Note
This relationship cannot be used for observations with missing data, and performs no validation checks.
Export Data Blocks – Select data to export. Selection can be done through the toggle buttons, where orange indicates YES, black indicates NO. Note that the model data toggle (feature #2) impacts what is exported in this section. Refer to feature #2 description for more information.
Include Extra Information – Additional information may be appended to the end of each table for the ingredient ratios, class ratios, and mixture properties. Orange indicates YES, black indicates NO.
For the ingredient ratios table, the total sum (Sum) and number of ingredients used (# Used) for each row are appended to the right of the table. The number of times each ingredient is used (# Used) is appended to the bottom of the table. These values also appear in the Ratio tab.
For the class ratios table, the total sum (Sum) and number of classes used (# Used) for each row are appended to the right of the table. The number of times each class is used (# Used), and the minimum/maximum/median values of each column are appended to the bottom of the table. These values also appear in the Ratio tab.
For the mixture property table, the percent of data missing (% Missing) across all rows and all columns are appended to the right and bottom of each table, respectively. These values appear in the Mixture Properties tab (Generated Properties sub-tab).