Data

File – The dropdown menu provides the option to select:
New Project: Create a new project
Save Project (Ctrl + S): Save the current project
Save Project As: Save the current project in a specified location
Load Project: Load a previously saved project
Exit: Closes the application
About – View more information about the application, including the EULA and 3rd party licenses.
Import Data – Import data from a spreadsheet application. See Import Example for step-by-step instructions on data import.
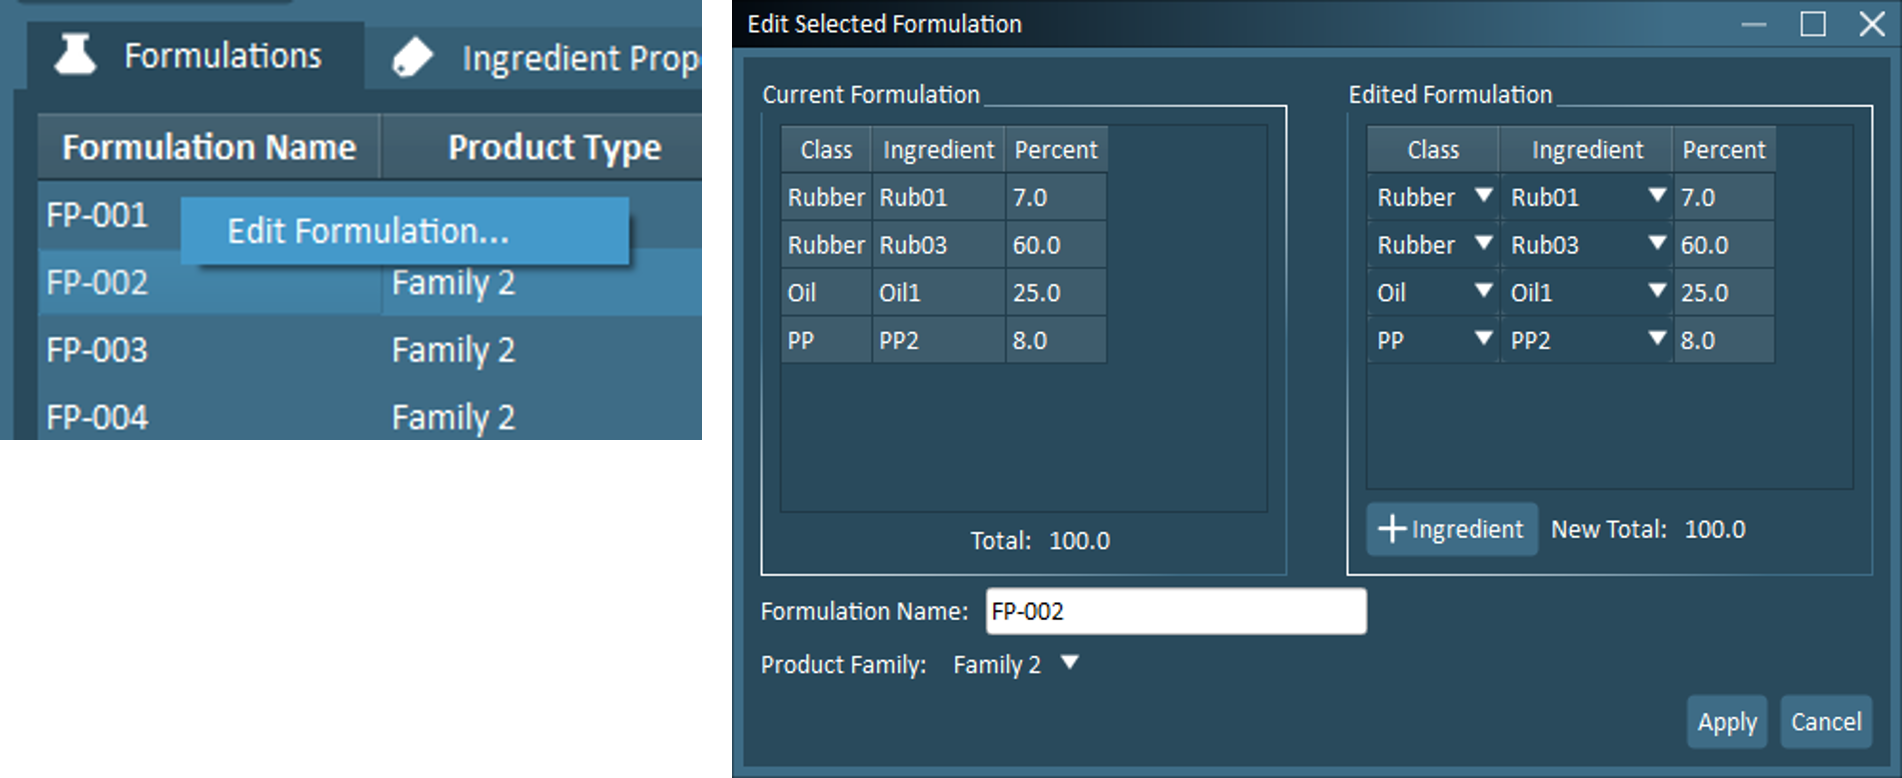
Formulations – View and edit the summary of formulation data by ingredient.
Right-click on any formulation to open the Edit Selected Formulation screen
In the Edit Selected Formulations screen, the user may adjust ingredient selections, ingredient amounts, add new ingredients, remove existing ingredients (by setting fraction/percent/quantity to zero), rename the formulation, and assign the formulation to a different product family.
After all edits are complete, click “Apply”
Important
Applying any formulation edits will reset all project file configurations beyond the Data screen.
Ingredient Properties – View the imported property data, listed by class.
Class – Dropdown menu to select an ingredient class and view its properties.
Copy Table – Copy the property table to paste into a spreadsheet application.
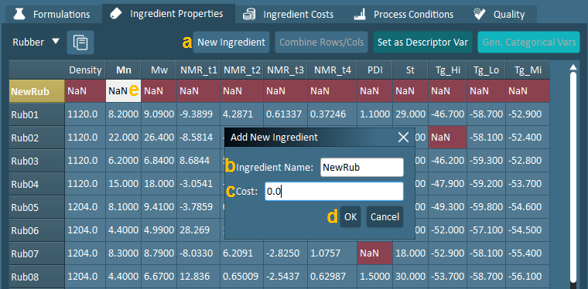
New Ingredient – Create a row for a new ingredient. Provide a name and cost for the new ingredient. An example of the workflow required to create a new ingredient is provided below:
Click “New Ingredient”.
Specify a name for the new ingredient.
Specify a cost for the new ingredient.
Click “OK”.
Once this is completed, the new row is added to the ingredient properties table (with all missing properties). The user may now click on any cell to provide a value for the ingredient property.
Combine Rows/Cols – Rows or columns may be merged (may be useful if there are duplicate ingredients that have been mistakenly named differently). The rules for combining data are as follows:
Only 2 columns or rows can be combined at a time.
When combining columns/rows, the average values between the two are used in the new column/row.
This option is also available in the Quality Data and Process Conditions tabs.
Set as Descriptor Var – String Variable / Categorical Expansion – Categorical properties may be expanded and converted into a binary system consisting of 0 and 1.
Note
If the user wishes to replace values, they must do it while the variable is designated as a “Variable” and not as a “Descriptor Variable” (see Replacement Rules).
An example of the workflow required to create categorical variables is provided below:
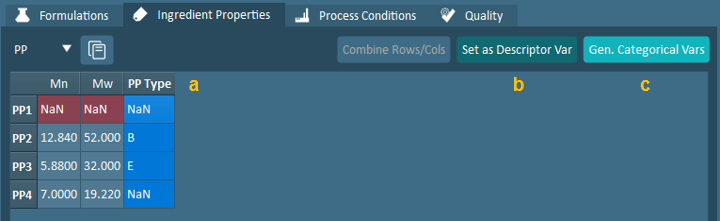
Select the column containing categorical data.
Click “Set as Descriptor Var”.
Click “Gen. Categorical Vars”.
Once this is completed, the resulting expanded categorical variables are shown below.
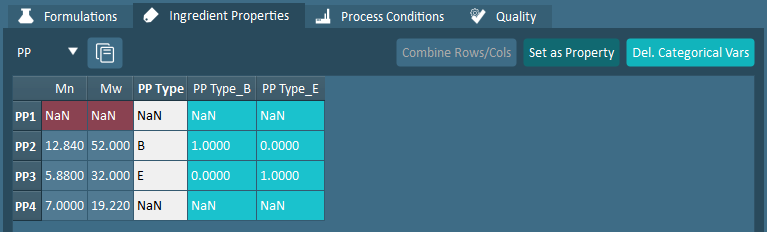
In this example, PP Type contained categoricals “B” and “E”, as well as missing data. The variable was expanded as PP Type_B and PP Type_E with 1 and 0 to categorize each.
This feature is also available in the Quality Data and Process Conditions tabs.
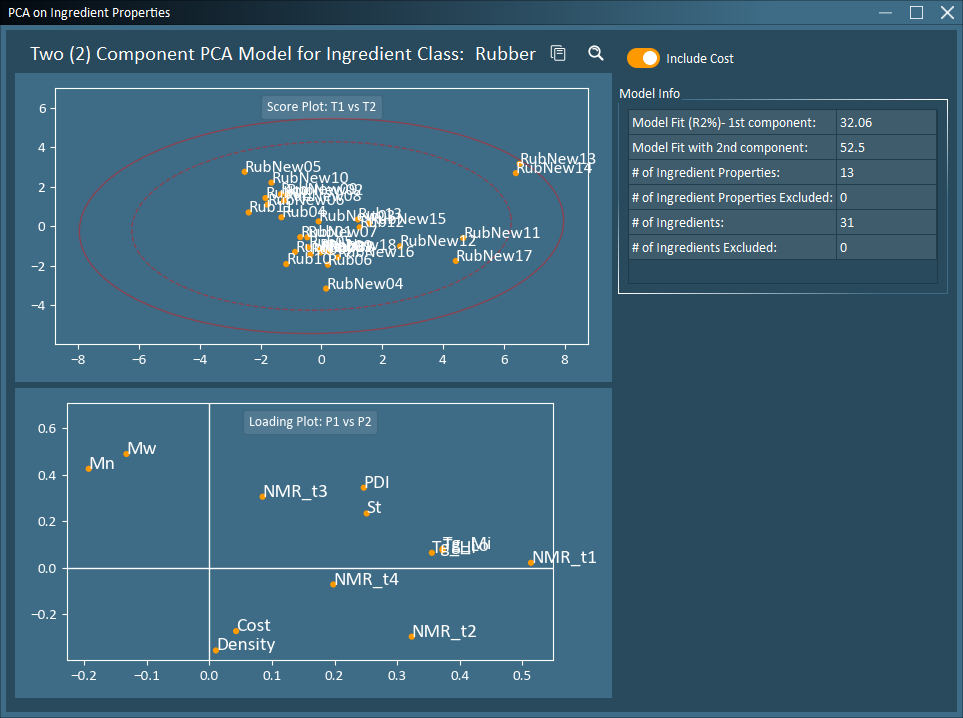
View PCA – View a 2-component PCA model on the Ingredient Properties for the current class.
This feature generates a score plot and loading plot in addition to a tabular summary of the 2-component model. Cost, if imported, can be included or excluded from this PCA model with the provided toggle.
Ingredient Costs – View the imported ingredient cost data by class.
Process Conditions – View the imported process data and time-series process data for each product.
Note
A new Process Conditions block called “Quantities” is automatically created when formulations are imported with “Quantity” as the selected units (as opposed to “Fraction” or “Percent”). This block contains one variable, which is the sum of the ingredient quantities for each formulation.
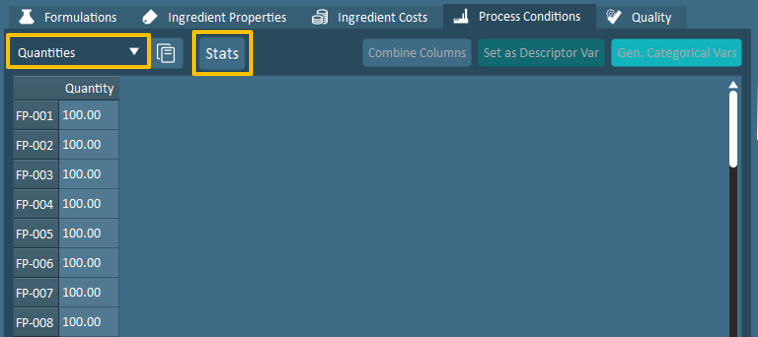
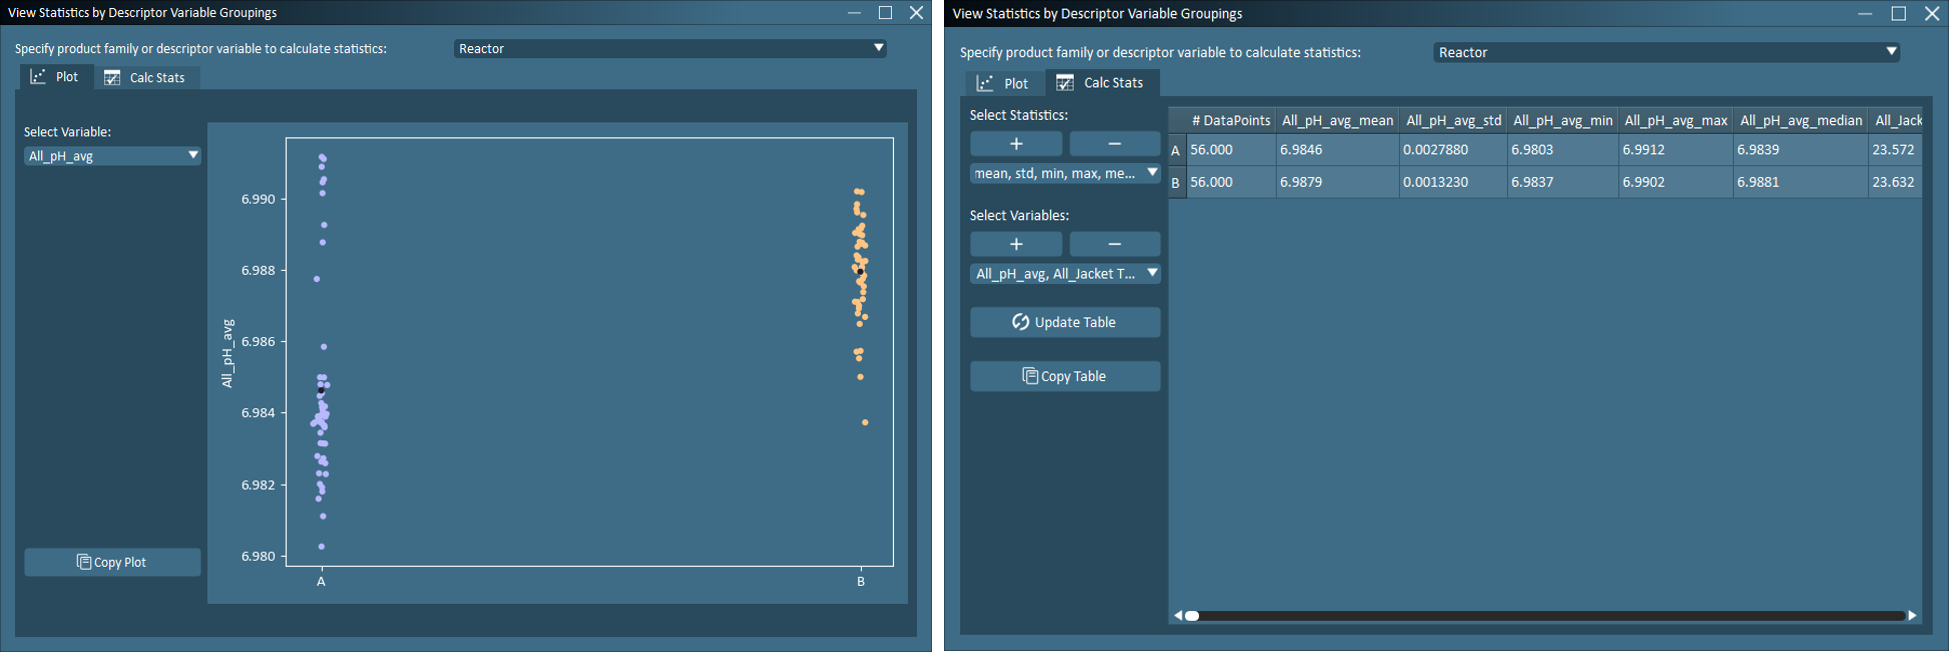
Use the “Stats” button to calculate and view additional statistics based on product family, replicates, or any descriptor variable.
Quality Data – View the imported quality data for each product.
Dataset Info – Key information of the dataset is listed as per the following:
Number of unique formulations (Note that names are case sensitive)
Number of unique ingredients (Note that names are case sensitive)
Number of unique ingredient classes
Number of unique product types
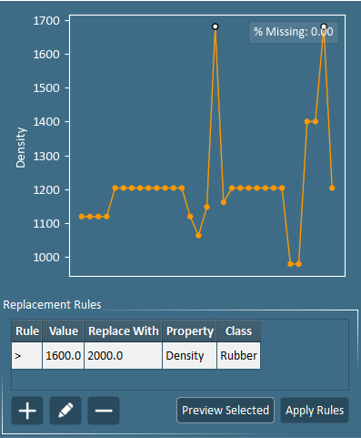
Ingredient Property Plot – A line plot generated based on the column of the currently selected ingredient property cell is displayed, with:
Each ingredient is listed on the X axis in the table order (alphabetical-order).
Property values of each ingredient listed on the Y axis.
The percentage of missing data (NaN) in the column is listed at the top right of the plot.
Replacement Rules – Property values (string and numerical) from Ingredient Properties, Process Conditions and Quality data may be replaced with user-designated rules. Replacement rules are only applied to the specified ingredient property variable within the active data block.
Note
If the user wishes to replace values from a categorical variable, then the variable must be set as a normal “Variable” and not as a “Descriptor Variable”. The user must replace values before any categorical variable expansion.
The user may select from the following:
 – Create a new replacement rule. Replace multiple instances of numeric or non-numeric data with user-defined inequality statements (<, >, =).
 – Edit an existing rule.
 – Delete an existing rule.
 – Preview all cells that will be affected by the replacement rules. (Cells will be highlighted in the currently selected table).
 – Apply the specified rules to the currently selected table.
An example is shown below to replace values greater than 1600 with 2000 under the “Density” variable:
Under Replacement Rules, select the “+” button.”
The Value Replacement Rule will appear. Use the available dropdowns and fields to select the property of interest (Density), values to replace (>1600), and the desired replacement value (2000). Then click OK.
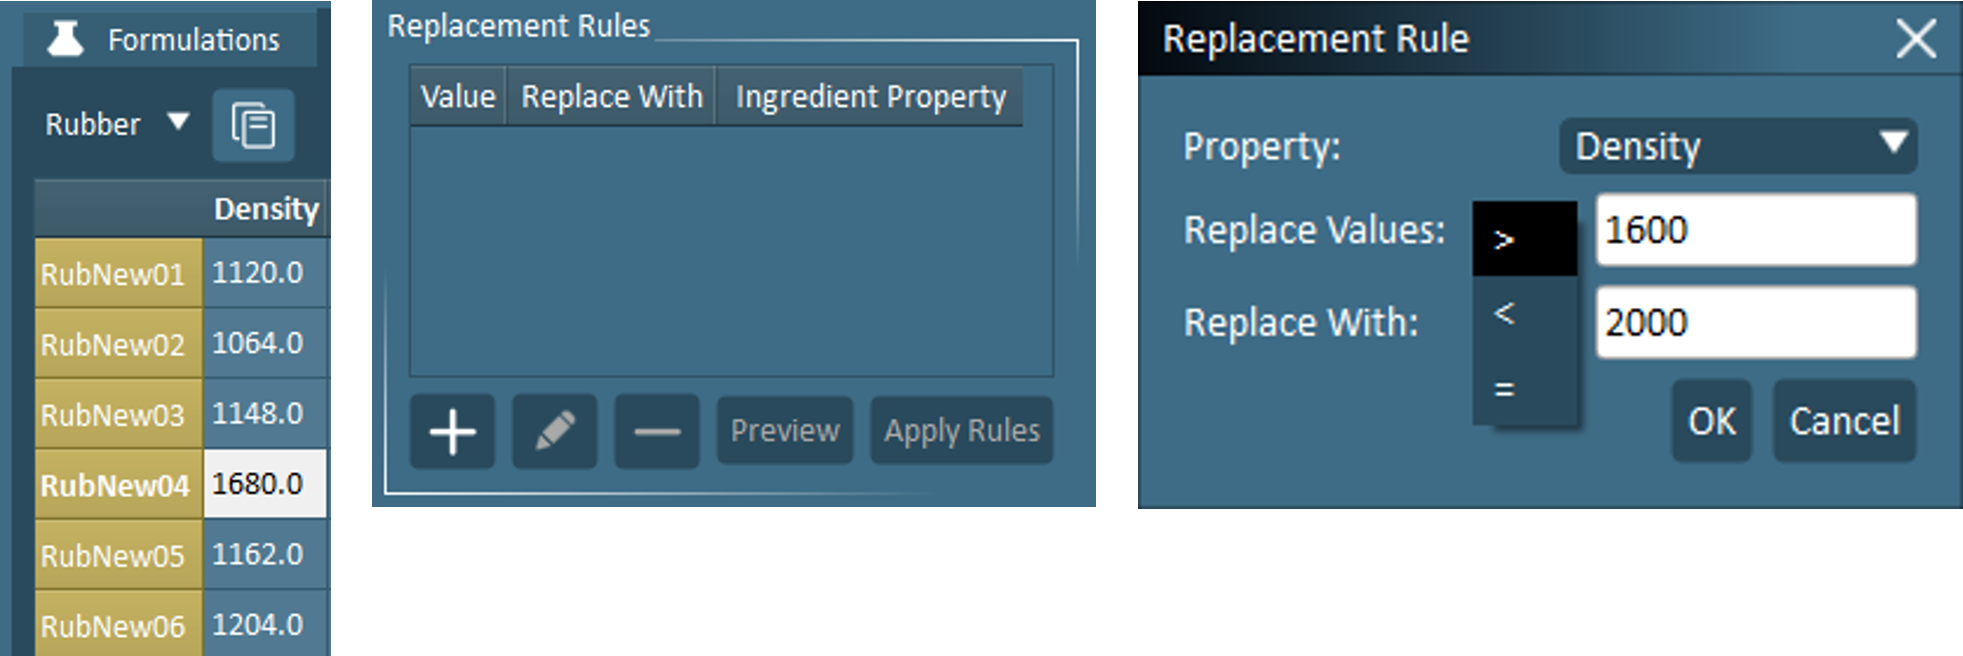
The new rule will appear in the Replacement Rules box. Click on the newly created rule, then click Preview to view the cells that will be changed. The affected datapoints are also indicated on the line plot. Click Apply Rules to apply.
Import Example
The following section follows an example of importing a dataset into the FormuSense software. The process will vary depending on the dataset used, but will generally follow the same steps.
The data import will begin once Import Data is selected in the main application window in the Data tab.
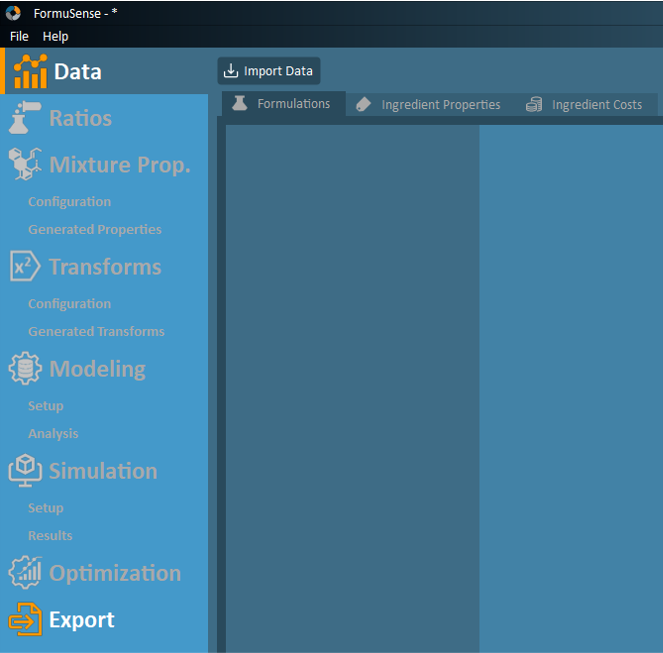
The main window of the FormuSense software. Click Import Data to begin the import process.
Next, the user will be prompted to select a spreadsheet file (e.g. .xlsx, .xls) to import into the program. See Preparing Data for Import in Microsoft® Excel®
Once the data is selected, the user can assign the data type of each sheet, if desired. As outlined in Preparing Data for Import in Microsoft® Excel®, the following lists the possible data types:
Formulations: Contains the recipes (formulations) of the products and can include the formulation names, product type, ingredient names, ingredient class names, and amount (in fractional form, ratio percent, or quantity). Only 1 sheet can be selected as the formulations.
Ingredient Properties: Contains the properties/variables of each ingredient class and their respective ingredients. Multiple sheets can be selected as ingredient properties.
In the Class Name column, the value must match the name of the class in the Formulations sheet.
Process Conditions: Contains the process conditions for each formulation. Each sheet can contain multiple process variables, and the user may import several process condition sheets.
Quality Data: Contains the quality data for each formulation. Each sheet can contain multiple quality variables, and the user may import several quality sheets.
Time-Series Process: Contains the trajectory process conditions (equally spaced time-series measurements) for each formulation. Each sheet can contain multiple process variables and may include a batch phase/stage variable, and the user may import several time-series process sheets.
Don’t Import: Do not import the worksheet. This is set by default.
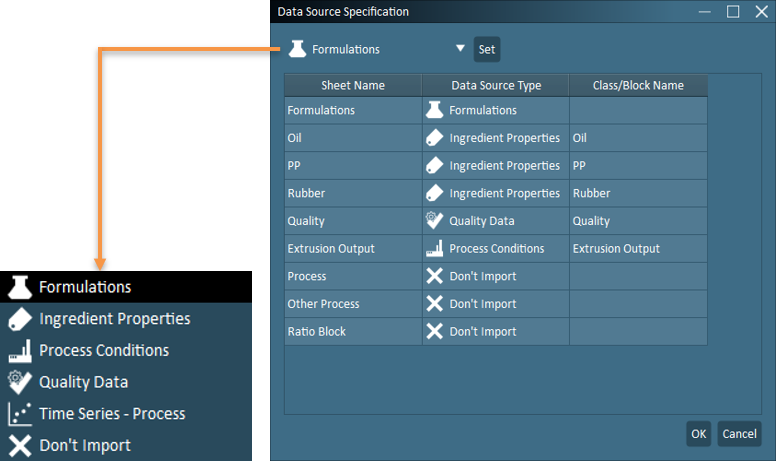
Specification window for selecting the data source type for the imported data.
In the next window, the user will be prompted to assign data types to the columns of the Formulations sheet. Here, the user will select the column using the column header and then select from the options on the right side of the window. The details of each data type are listed as follows:
Formulation Names: Names of the formulations/products.
Product Type (optional): Names of product type if available.
Ingredient Names (required): Names of the ingredients.
Ingredient Class Names (required): Class names of the ingredients.
Amount (one is required): Numerical values of each ingredient in the products. One of the following must be selected.
Fraction: Fractional amount in formulation (between 0 and 1) – formulations must sum to 1.
Percent: Percent amount in formulation (between 0 and 100) – formulations must sum to 100.
Quantity: Mass or other relevant amount in formulation (can be in any mass unit, phr, moles, etc.) – formulations can sum to any amount, but should be in the same units across all formulations.
Note
If fraction or percent are chosen, the Sum column for formulations which violate the sum to 1 (fraction) or sum to 100 (percent) rules will be highlighted in yellow (within 0.1%). See Ratios for more information.
Clear Column: Remove data type from any column.
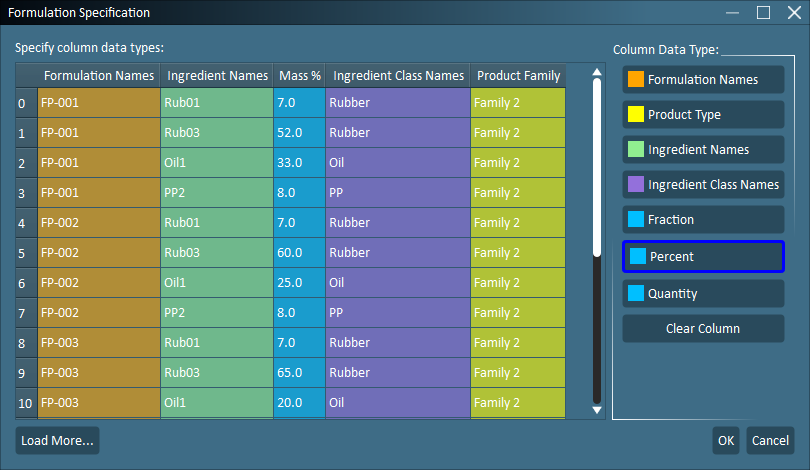
Formulation specification window to select data type options for the imported formulation data.
Once the data has been imported, the user may view and edit the breakdown of each formulation, the imported ingredient properties, quality data, and process data. See Data for further details.
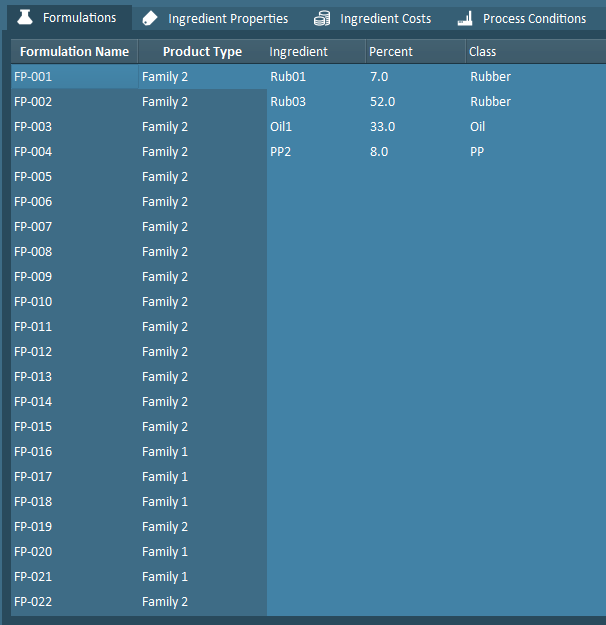
Breakdown of formulation by ingredient.
When the user generates the ingredient ratio tables, the data shown will be in the same format that was selected during the Data stage for the formulation amounts (i.e. fraction, percent, quantity). However, for the mixture property calculation, the fractional form will be used.
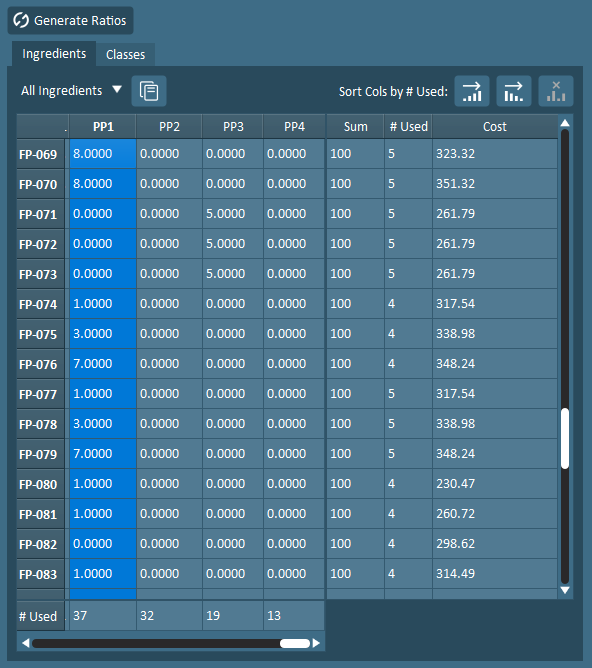
Data viewer for the Ratio tab.