Preparing Data for Import in Microsoft® Excel®
Before proceeding with the program, the data must be formatted appropriately in Microsoft® Excel® prior to import. The FormuSense software accepts the following data for analysis:
Formulations
Ingredient Properties (can only be imported in the presence of Formulations data)
Process Conditions
Quality Data
Time-Series Process Conditions
While each of the above data types are optional for import to FormuSense, at least one block of data must be imported in order to proceed. Furthermore, Formulations data must be imported in order to import Ingredient Properties.
The imported data must be saved in a valid Microsoft® Excel® file format (e.g. .xlsx, .xls).
Formulations
Any formulation data imported to FormuSense must be contained in a single Microsoft® Excel® sheet.
If imported, the formulations sheet must contain:
Product/formulation names
Ingredient names in all formulations
Ingredient amounts (fractional, percentage, or quantity), any values found to be less than 0 will be automatically converted to 0:
Fraction: Fractional amount in formulation (between 0 and 1) – formulations should sum to 1.
Percent: Percent amount in formulation (between 0 and 100) – formulations should sum to 100.
Quantity: Mass or other relevant amount in formulation (can be in any mass unit, PHR, moles, etc.) – formulations can sum to any amount, but should be in the same units across all formulations.
Note
If fraction or percent are chosen, the Sum column for formulations which violate the sum to 1 (fraction) or sum to 100 (percent) rules will be highlighted in yellow (within 0.1%).
See Ratios for further details.
The formulations sheet may optionally have:
Classes for all ingredients
Product type
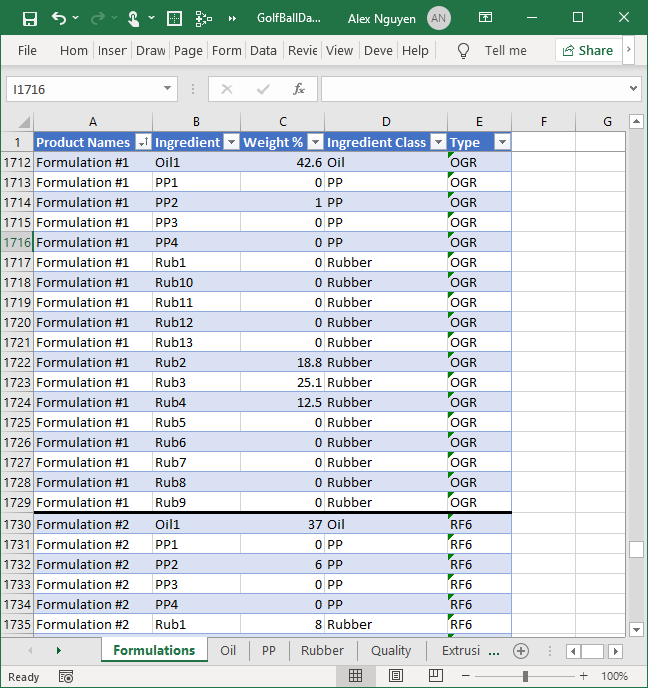
The following is an example of formulation data using weight percent as the amount type:

Example of formulation/recipe data, where product ingredients are listed in each row, with their respective formulation amounts, ingredient classes, and product type.
In the example above, the data is listed as follows:
Column A: Formulation Names
Column B: Ingredient Names
Column C: Ingredient Amount (Weight percentage - numbers between 0 and 100 that sum to 100)
Column D: Ingredient Class Names (Must match the names of the classes for the ingredient properties)
Column E: Product Type (Optional, but is recommended if available)
Note
Ensure that the formulations sheet does not contain empty rows between ingredients and formulations. Failing to do so will introduce missing data properties and classes when imported into FormuSense.
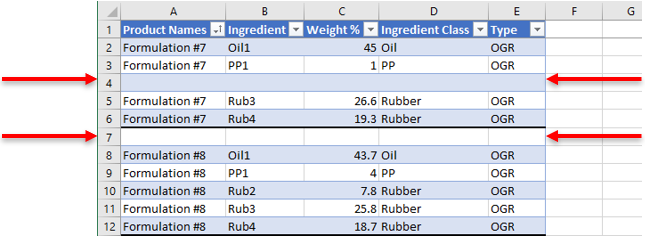
Example of POOR formulation/recipe data, where there is a discontinuity between ingredients and formulations.
Alternative Format
In the prior example dataset, amounts for unused ingredients in each formulation were not listed. The dataset is permitted to include unused ingredients if desired and the following is an acceptable input:
Example of alternative formulation/recipe data, where unused ingredients are shown in the formulations.
Note - Unused Ingredients
Formulations with ingredients that have amounts (Fraction/Percent/Quantity) \(\leq 0\) are automatically removed from those particular formulations.
Ingredient Properties
The ingredient properties sheets contain the properties/variables of each ingredient class and their respective ingredients. Multiple sheets can be set as ingredient properties.
The format of the ingredient properties must be set as follows:
The name of the sheet must match the class name as listed in the Formulations sheet.
There must be separate worksheets for each unique ingredient class.
Ingredients are listed in column A.
There cannot be duplicate ingredients.
If an ingredient is used in Formulations but is not listed in the ingredient properties, then the FormuSense software will auto-add the ingredient with all missing properties.
Properties are listed in the subsequent columns.
There cannot be duplicate properties within a class.
Properties can be numerical or categorical/string.
Ingredient costs can be included as a column in ingredient properties.
Any missing values should be left blank (rather than entered as zero).
Note
Any imported ingredient properties named “Cost” are automatically parsed into a separate “Ingredient Costs” tab. Costs are automatically excluded from model-building, but are displayed in the ratios screen and used in simulation.
If an entire ingredient class does not have any properties, then the user may choose to not import a sheet for that class. In this case, the FormuSense software will auto-generate a class ratio table with no properties for that class.
The following is an example of ingredient properties for the Rubber class:
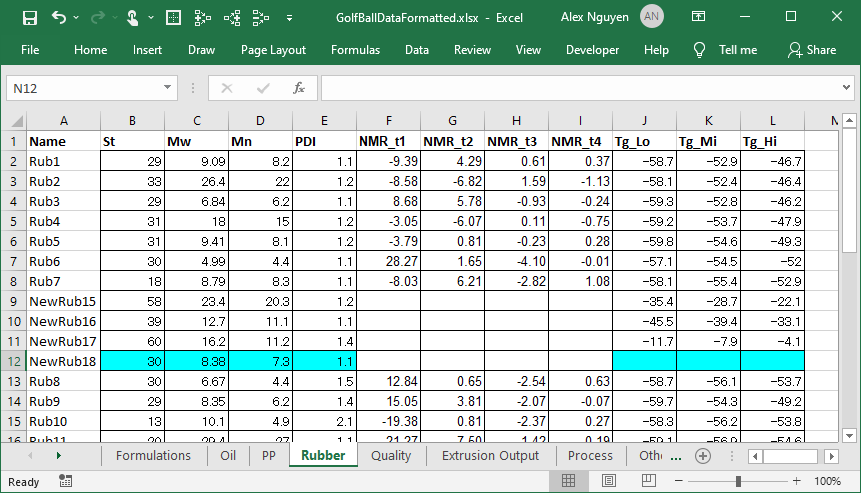
Example of ingredient properties. Ingredients are listed in the first column, with the various properties listed in the first row. Missing properties may be left blank.
In this example, the ingredients are listed in column A (e.g. Rub1, Rub2…), properties are listed in subsequent columns (e.g. St, Mw, Mn…), and data listed in their respective cells.
Process Conditions
The process conditions sheets contain any recorded process conditions for each formulation. Process conditions may be static (i.e. one measurement per variable per formulation) or dynamic (time-series trajectories of process variable(s).) The following guidelines apply to standard (static) process conditions.
Each sheet can contain multiple process variables, and the user may import several process data sheets.
The format of the process data is as follows:
Products/formulations listed in the first column.
Process variables listed in the subsequent columns.
The following is an example of process data, where the first column lists the formulations and the second column contains the Melt Temperature. The user may choose to add more variables in the same sheet, or create new sheets for different process units or process conditions.

Example of process data. Formulations are listed in the first column, with each process variable listed after.
Quality Data
The quality data (output data) sheets contain the quality data for each formulation. Each sheet can contain multiple quality variables and the user may import several quality sheets.
The format of the quality data is similar to the process conditions, where the formulations are listed in the first column and quality variables are listed in subsequent columns.
Intentional replicates may be included in quality data by repeating the same formulation name(s) multiple times.
Note
When a Formulation Name occurs more than once in Quality, FormuSense appends each additional occurence of the Formulation Name, creates a new descriptor variable called Master Formulation to readily identify all related replicates, and replicates formulation(s) ingredients and process conditions where relevant.
The following is an example of quality data with 7 quality variables (Y1, Y2, Y3, Y4, Y5, Y6, Y7):
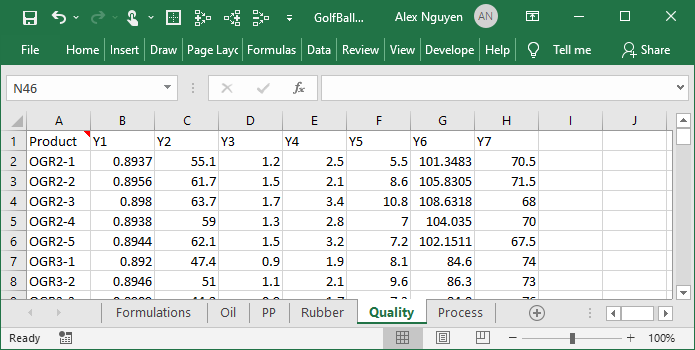
Example of quality data. Formulations are listed in the first column, with each output/quality variable listed in the subsequent columns.
Time-Series Process Conditions
The process conditions sheets contain any recorded process conditions for each formulation. Process conditions may be static (i.e. one measurement per variable, per formulation) or dynamic (time-series trajectories of process variable(s).) The following guidelines apply to dynamic process conditions. Each sheet can contain multiple time-series variables, and the user may import several time-series sheets.
The format of time-series process data is as follows:
Formulations/products/batch listed in the first column.
Batch phase/stage listed in any subsequent column (where relevant).
Process variables listed in the subsequent columns.
One row for each equally-spaced time point in the trajectory measurement.
Note
No timestamp is needed; FormuSense assumes that all trajectory measurements are taken at equally spaced time points.
The following is an example of time-series process data, where the first column lists the formulations and the second column contains the batch phase, followed by 5 time-series variables. The user may choose to add many variables in the same sheet, or create new sheets for different process units or time-series measurements.
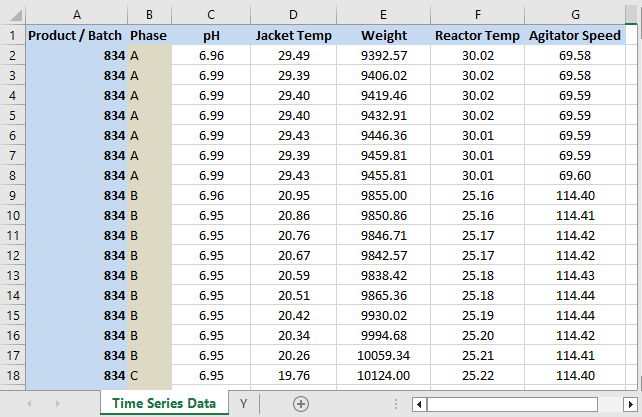
Example of time-series process data. Formulations are listed in the first column, batch phase in the second column, and each process variable listed after.