Program Overview and Workflow
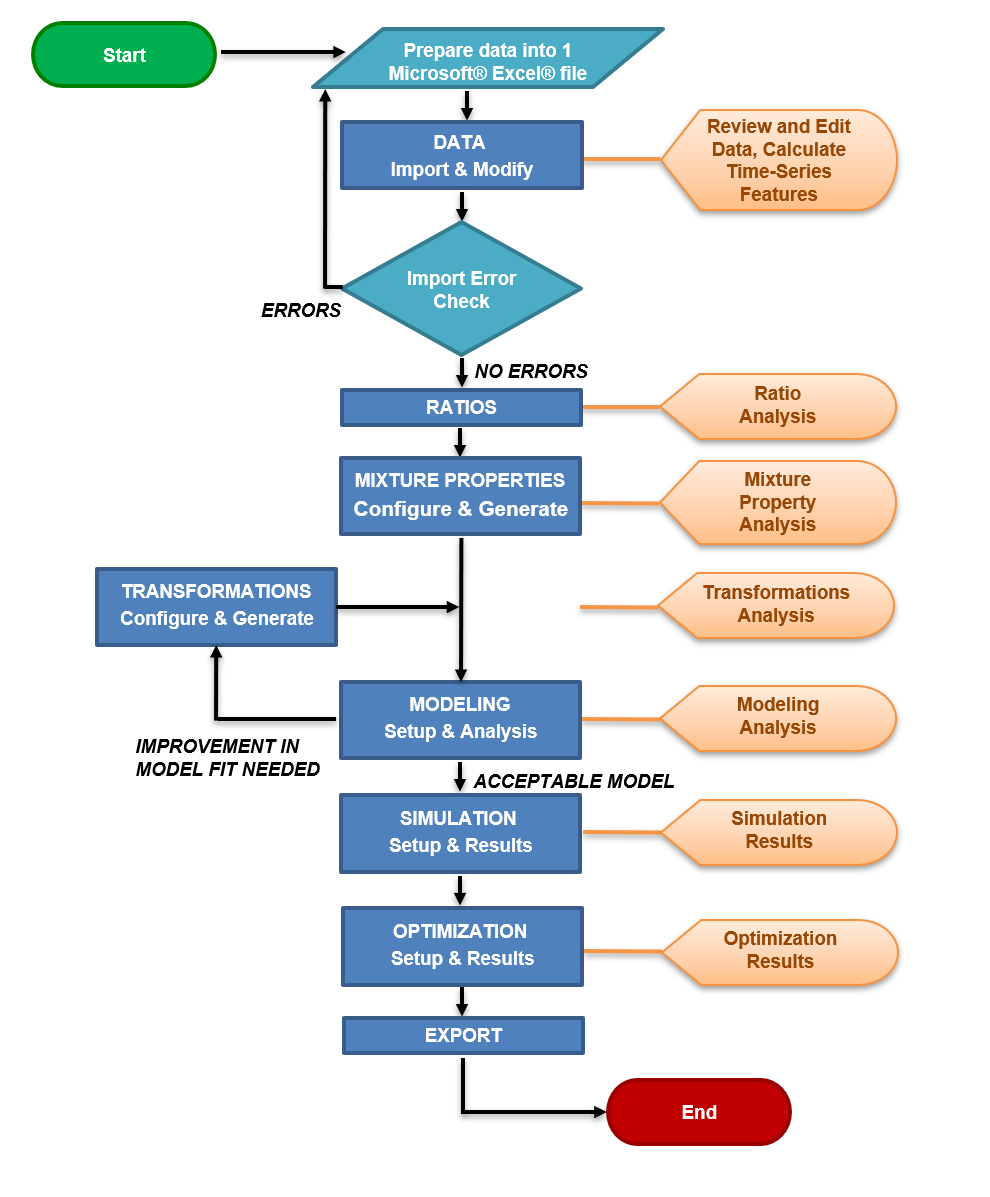
The FormuSense software is designed to streamline the process of calculating mixture properties. The flowchart below outlines this process, along with a brief description of each stage:
DATA
The purpose of this stage is to import data (formulations, ingredient properties, quality/output data, and process conditions).
In this stage, the user may view and edit the breakdown of each formulation, ingredient properties for each class of ingredients, quality data with stats, and process data with stats. Additionally, the user may view a 2-component PCA on any ingredient class, as well as set descriptor (string) variables and auto-generate the categorical variable equivalents for these descriptors, and extract key features from time-series process data.
The user can efficiently replace either values or strings with a specified value in this stage.
Multiple ingredients and/or properties can be combined at this stage.
Further details and step-by-step instructions can be found in Import Example.
RATIOS
The purpose of this stage is to generate the ratio table required for the mixture property calculation.
The ratio table is generated based on the imported data and lists formulations per row and ingredients per column.
Ratio tables are generated for all formulation and ingredient combinations and on a per class basis. Class ratios are also generated, which displays the amount of each class used for the formulations.
Various statistics may be viewed, such as percent used and data plots of each ingredient.
MIXTURE PROPERTIES
The purpose of this stage is to generate and analyze mixture properties.
Mixture properties can be configured per ingredient class. Users may specify mixture property type as additive or weighted average, and each individual property may be specified as linear, logarithmic, or natural logarithm.
Global properties can also be calculated. An equivalent/related property from each ingredient class is selected by the user for use in a global property.
Once the properties are generated, various statistics may be viewed, such as percent missing data and data plots of each property for all formulations.
TRANSFORMATIONS
The purpose of this stage is to generate and analyze transformations to address non-linearities and interactions between variables
Transformations can be manually configured. Users may select a data block of interest, then specify which specific variable(s) and transformation equation(s) to apply. Users also have the option to apply all possible transformations to all variables in a data block.
Alternatively, FormuSense can suggest data transformations to the user, by evaluating all possible options and selecting those that meet configurable settings (such as minimum correlation to a quality variable, and maximum percent missing data).
Once the transformations have been configured and generated, users may view line plots of all transformations and a bar plot of the percent missing.
MODELING
The purpose of this stage is to configure and analyze multivariate models.
Multiple Pincipal Component Analysis (PCA) and/or Partial Least Squares (PLS) models can be configured. Users may specify what variables and formulations to include or exclude. Logarithmic transformations can be applied to specified variables. The number of principal components can be adjusted.
Users can specify a training set and prediction set to evaluate model fit (PCA and PLS) and the ability of the model to predict output variables (PLS).
Once the models are configured and generated, various graphical visualizations become available for the purposes of model evaluation, pruning, and interpretation.
SIMULATION
The purpose of this stage is to specify values for all input variables (X) for any PCA or PLS model to then project the results onto the latent space. Model validity metrics, formulation cost, and mixture properties are calculated when applicable. For PLS models, simulation also predicts values of outcome variables (Y), which are typically quality properties, by applying the developed model(s).
Once simulations are configured and generated, various tabular and graphical summaries are provided to evaluate all scenario results (quality, cost, model validity), relative to the historical formulations that were used to build the model.
OPTIMIZATION
The purpose of this stage is to specify quality variable targets (PLS) or score space targets (PCA or PLS) to determine the optimal input values (X) to achieve those targets under given constraints.
After targets, bound constraints and tuning parameters have been selected and the optimization problem is solved, various tabular and graphical summaries are provided to evaluate solution scenarios that prioritize or balance quality and raw material costs.
Solution scenarios can also be compared to the closest-matching existing historical product.
EXPORT
The purpose of this stage is to export data to Microsoft® Excel® in .xlsx format.
Multiple data tables from FormuSense may be selected for export. Exportable data includes: formulations, ingredient properties, process conditions, quality data, the full ratio table, class ratios, mixture properties per class, and the global mixture properties.
For the ingredient ratio and class ratio data, optional statistics (usage, sums) can be exported; for the mixture properties, percentage of missing data can be exported.