Optimization
Important
Optimization setup is highly dependent upon the model type and model structure. If a user configures and generates optimization scenarios, then proceeds to make changes from within any of the earlier navigation screens (Data, Ratios, Mixture Prop., Modeling) then all optimization configurations and results will be erased.
Setup
Optimization setup allows the user to provide quality variable targets (PLS) or score space targerts (PCA or PLS) to determine the optimal input values (X) to achieve those targets under given constraints. Depending on the model type (PCA or PLS) and structure (variables included or excluded), optimization setup features #8-13 may or may not be available to the user.
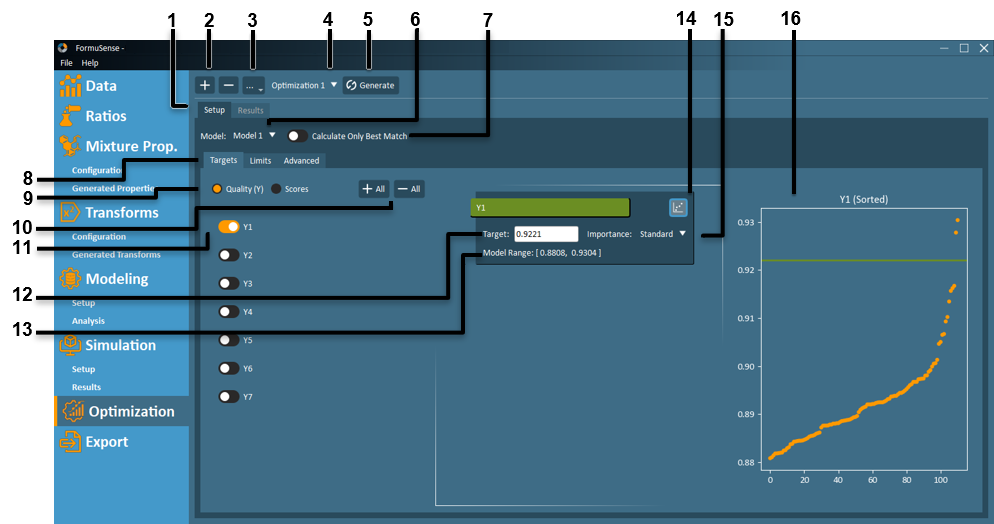
Setup – Access all optimization setup configuration options.

 – Create a new optimization scenario or delete an existing scenario.
Rename or New Optimization As.. – Rename the current optimization scenario, or create a new optimization scenario using all configuration options of the current scenario.
Optimization Selection – Select an optimization scenario to view or edit from this dropdown list.
Generate – Perform optimization using all configured settings in the optimization setup.
Model Selection – Select a model to use in the optimization from this dropdown list. All models configured in the Modeling stage are available in this dropdown.
Calculate Only Best Match – Turning this toggle on will prevent FormuSense from running the full optimization algorithm to develop a new formulation. Instead, FormuSense will only locate the past/existing formulation that most closely matches the quality or score targets specified in the optimization setup. It also takes into account constraints when calculating the closest matching.
Note
It is often a useful workflow to calculate best match only before proceeding with the full optimization algorithm Viewing which constraints are touched or exceeded for the closest matching can help the user determine if any default constraints should be loosened.
Targets – View and edit optimization targets for the current optimization scenario.
Quality and Scores – Choose to enter optimization targets in terms of quality (raw units), or in the PLS score space.
Note
Quality targets can only be specified for PLS models. Optimization targets for PCA models must be specified in the score space.
Add or Remove All Targets – “+All” opens a target input field for all quality variables, while “-All” removes all target inputs fields.
Individual Target Toggle – Opens a target input field for the specific quality variable or score.
Target Value – Click on the target field to enter a value.
Model Range – Indicates the historical minimum and maximum [min, max] for that quality variable or score. This information is provided as a general reference when specifying optimization targets.
Create Plot – Plots the target value relative to the historical value of that quality variable or score. This information is provided as a general reference when specifying optimization targets.
Importance – Use this dropdown to set the importance of reaching the specified target as Standard or High.
View Plot – View the target and historical data for the selected quality or score after the Create Plot feature has been selected. Note that historical data is sorted in ascending order.
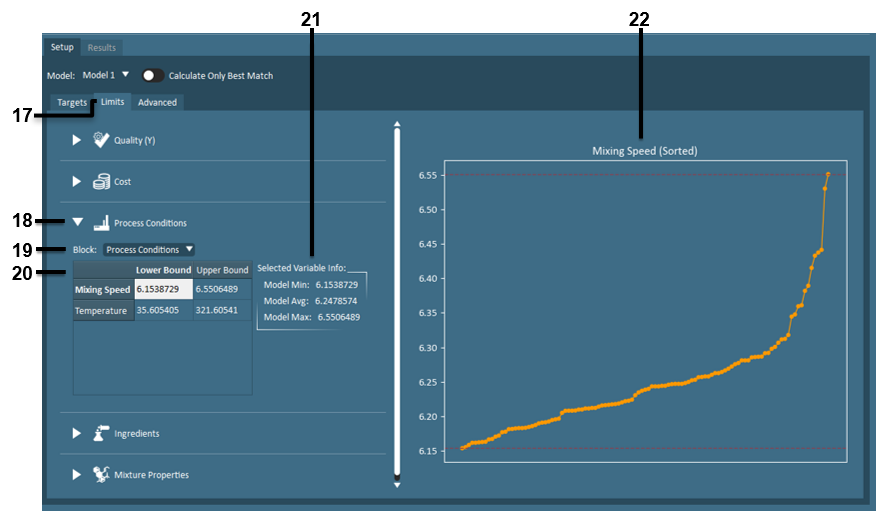
Limits – View and edit limits and bound constraints for the current optimization scenario.
Note
Depending on the model type (PCA or PLS) and structure (variables included or excluded), optimization setup features #17-20 may or may not be available to the user.
Limit Input Fields – View and edit limit input fields for a particular variable block (quality, cost, process conditions, ingredients or mixture properties).
Important
While blocks of quality variables included in a PLS model are automatically designated to separate outcome (Y) blocks, any blocks of quality variables included in a PCA model are treated as input (X) blocks by FormuSense and accessed in Optimization setup as separate process condition blocks.
Note
Default optimization limits in are as follows:
Quality (when 1 or more quality variables are targeted):- If the model includes the ratio block, only ingredients used in model formulations can be selected for classes.
Variables without targets: model dataset min & max
Variables with targets: +/- 1.5 standard deviations of target
Cost
Upper limit: 75th percentile of model dataset
Process and Quality (X)
Bounds: min and max of model dataset
Ingredients
Class bounds:
Bounds: min and max of model dataset
# Ingredients to Use bounds: min and max of model dataset
Min % to Use, If Used: min % used from any ingredient in that class in the model dataset
Ingredient bounds:
Ingredient availability: all ingredients available
Lower bound: 0 (Exception: If an ingredient is used in every formulation in the model dataset, then that ingredient lower bound defaults to the minimum ever used.)
Upper bound: Class upper bound
Mixture Properties
No bounds
Transforms
No bounds
Block – View and edit limits for any sub-block using the available dropdown.
Lower Bound and Upper Bound – Click on any field in this table to edit and plot the lower and upper bound for the given variable, as well as to populate the Selected Variable Info summary.
Selected Variable Info – Summary metrics of historical data for any presently selected variable in the limits tab.
Limit Plot – View active bounds relative to historical values of the currently selected variable. Note that historical data is sorted in ascending order.
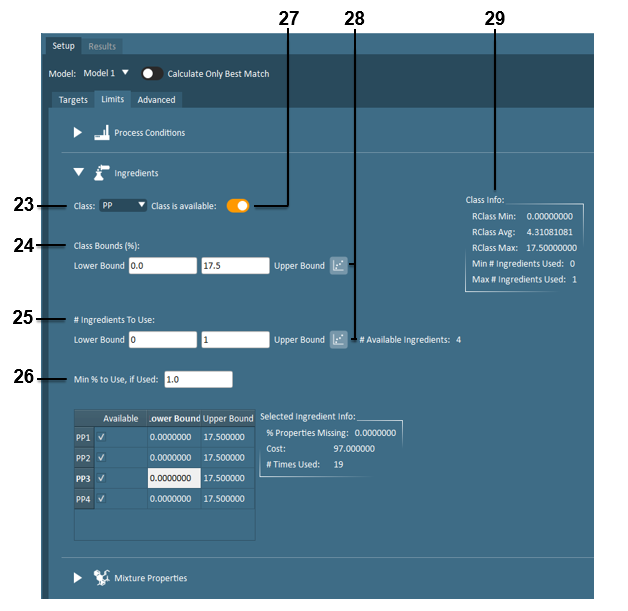
Class – View and edit limits for any ingredient class using the available dropdown.
Class Bounds – Input fields for ingredient class ratio upper bound and lower bound.
# Ingredients to Use – Input fields for the upper bound and lower bound on the number of ingredients that can be used from within the current ingredient class.
Min % to Use, if Used – Input field for the minimum ingredient ratio that must be used for any individual ingredient, from the current ingredient class, that is selected by the optimization.
Class is available – Toggle to make all ingredients from a particular ingredient class available or unavailable in the optimization.
Ingredient Limit Plot – Plot ingredient bounds relative to historical values. Note that historical values are plotted in ascending order.
Class Info – Summary metrics of historical data for any presently selected ingredient class in the limits tab.
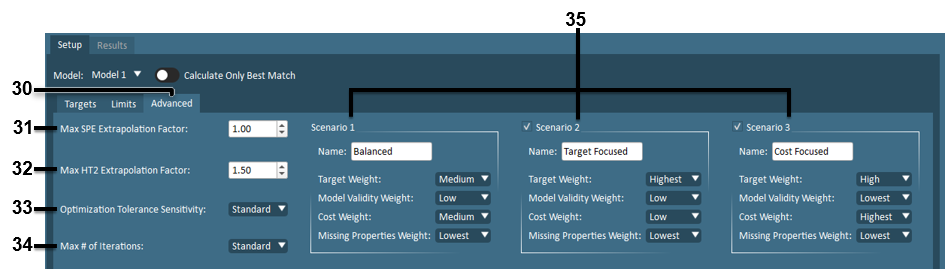
Advanced – View and edit optimization algorithm tuning parameters.
Max SPE Extrapolation Factor – Input field that limits how far the optimization may extrapolate beyond the historical data.
Max HT2 Extrapolation Factor – Input field that limits how much the optimization may deviate from the correlation structure of the historical data.
Optimization Tolerance Sensitivity – Input field that impacts the stopping criteria for the optimization algorithm. Low tolerance generally allows the algorithm to stop earlier, while high tolerance requires the algorithm to continue searching for a better solution.
Max # of Iterations – Input field that impacts the stopping criteria for the optimization algorithm. Selecting fewer iterations allows the algorithm to stop earlier, while higher iterations require the algorithm to continue searching for a better solution.
Note
Consider lowering the tolerance and/or the maximum number of iterations if the computation time of the optimization is longer than desired or the maximum number of iterations are reached.
Solution Scenarios – For each optimization configuration, up to three solution scenarios will be determined. By default, these scenarios aim to:
balance reaching optimization (quality) targets with minimizing raw material costs;
prioritize reaching optimization (quality or score) targets over minimizing raw material cost; and
prioritize minimizing raw material cost over reaching optimization (quality) targets.
Each solution scenario can be renamed, optimization weights can be adjusted from their defaults, and solution scenarios 2 and 3 may be excluded using the available checkbox. In addition to the quality target weight and cost weight, weights on model validity metrics (SPE and HT2) and the use of ingredients with missing ingredient properties can also be adjusted from their defaults.
Results
Depending on the model type (PCA or PLS) and structure (variables included or excluded), optimization result features #5-11 may or may not be available to the user.
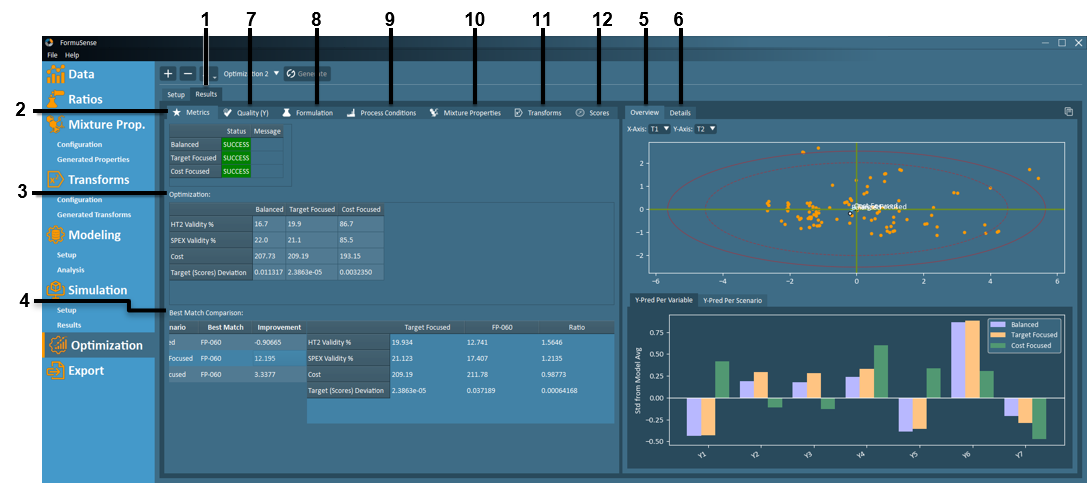
Results – Access all optimization results.
Tabular results may be denoted with the following symbols:
 Value approaches the lower limit specified in the optimization setup
 Value approaches upper limit specified in the optimization setup
 Value exceeds lower limit specified in the optimization setup
 Value exceeds upper limit specified in the optimization setup
 A target was specified for this variable in the optimization setup
Metrics – Summary of the optimization results, including a success/failure status, and error message for failed optimizations.
Optimization – Metrics that report the validity of each solution scenario (as a percentage of the HT2 or SPE limit), overall cost of the formulation, and deviation from quality targets.
Best Match Comparison – Identifies the existing historical formulation that best matches the optimization targets and limits.
Overview – Graphical summary of the optimization results, which includes a score plot (PCA and PLS models) and bar plot (PLS models). Optimization solution scenarios are clearly identified on the score plot, relative to historical formulations. The number of standard deviations from quality targets may be viewed on the bar plot per target variable or per solution scenario.
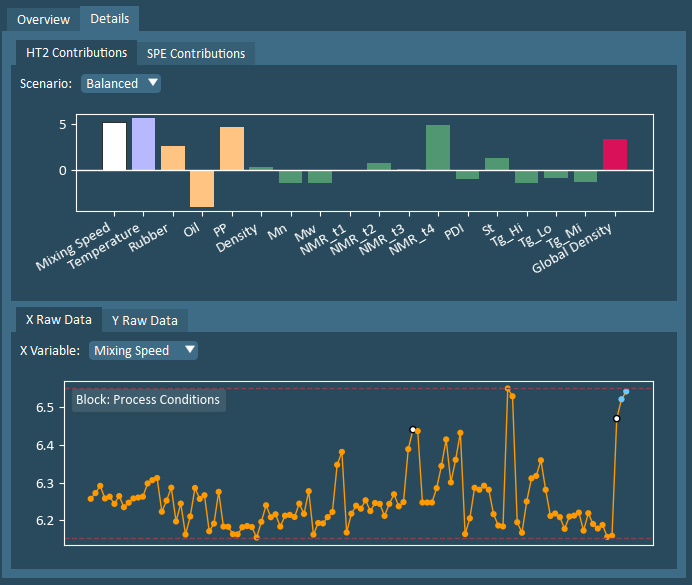
Details – Graphical summary of the HT2 and SPE contributions for each solution scenario, as well as the X Raw Data and Y Raw Data (only PLS models), including upper and lower limits and targets (where relevant).
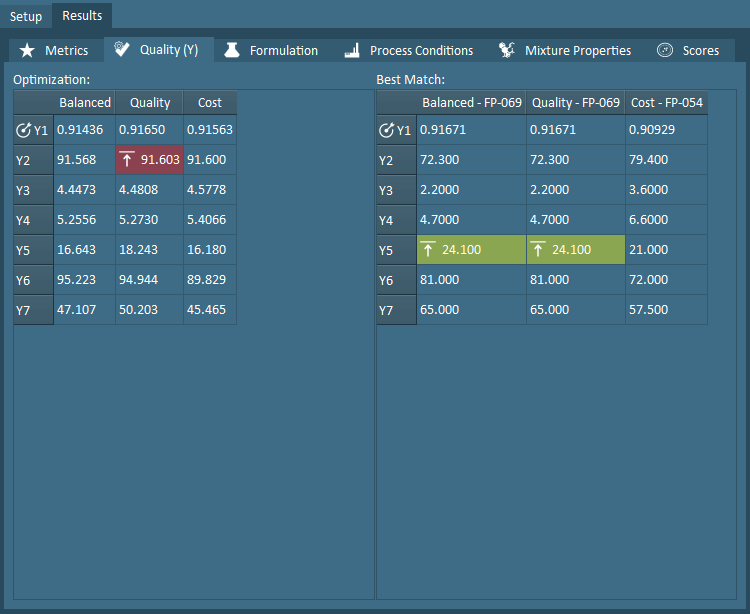
Quality (Y) – Tabular summary of optimization results for all outcome quality variables (PLS models) and all solution scenarios. Quality values for each Best Match (existing historical formulation) are also provided for comparison.
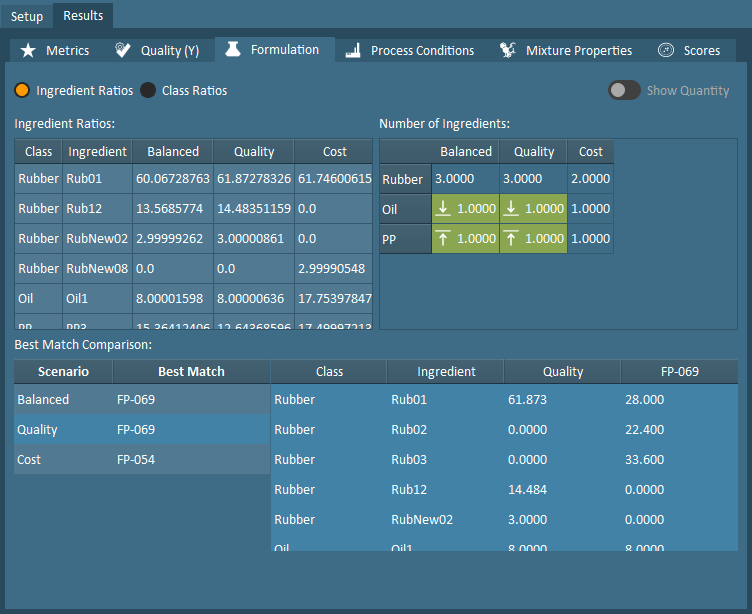
Formulation – Tabular summary of optimization results for ingredient ratios and ingredient class ratios for all solution scenarios. The number of ingredients used per class, as well as Best Match results are also provided.
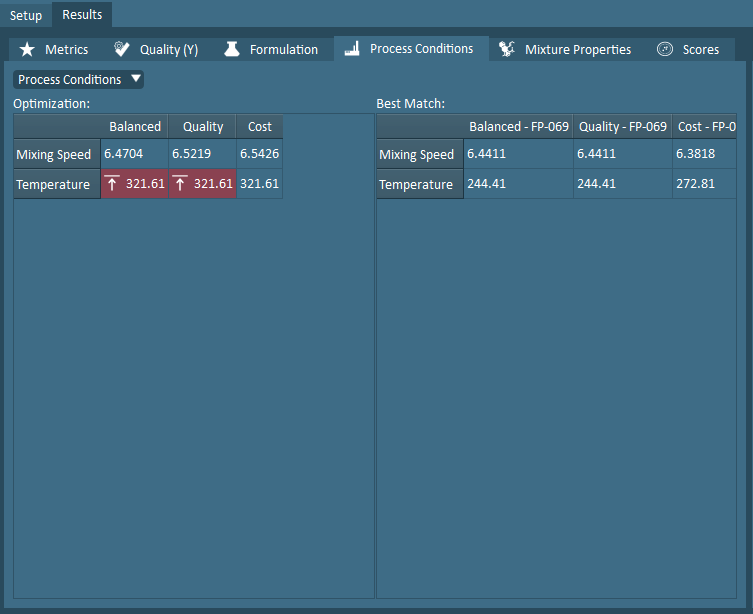
Process Conditions – Tabular summary of optimization results for process conditions for all solution scenarios. Best Match results are also provided for comparison.
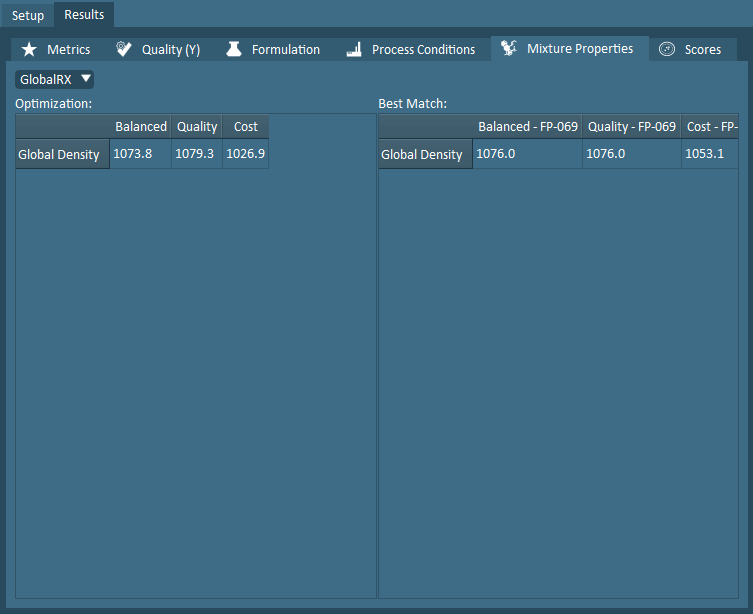
Mixture Properties – Tabular summary of optimization results for mixture properties for all solution scenarios. Best Match results are also provided for comparison.
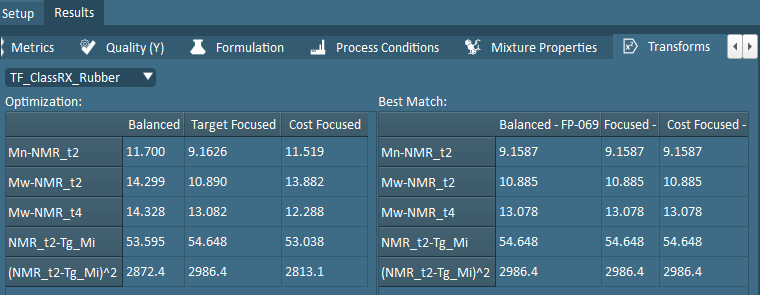
Transforms – Tabular summary of optimization results for data transforms for all solution scenarios. Best Match results are also provided for comparison.
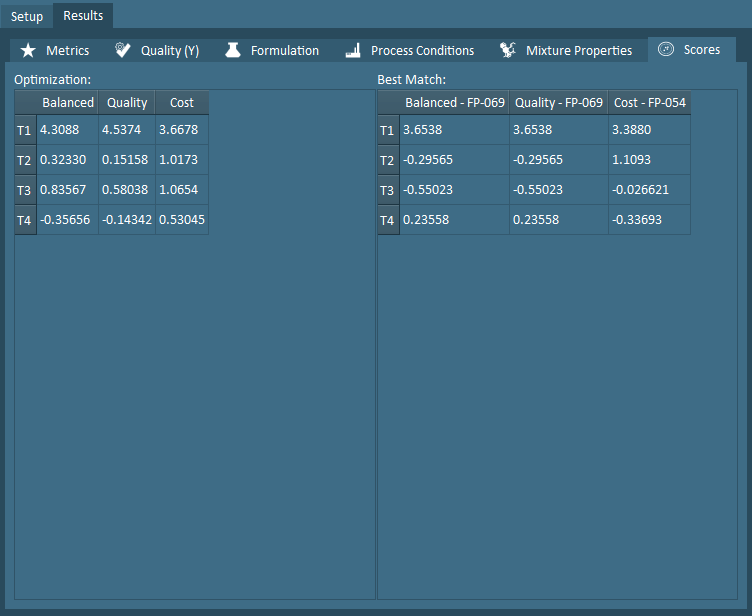
Scores – Tabular summary of optimization results for PLS scores for all solution scenarios. Best Match results are also provided for comparison.