Transformations
Configuration
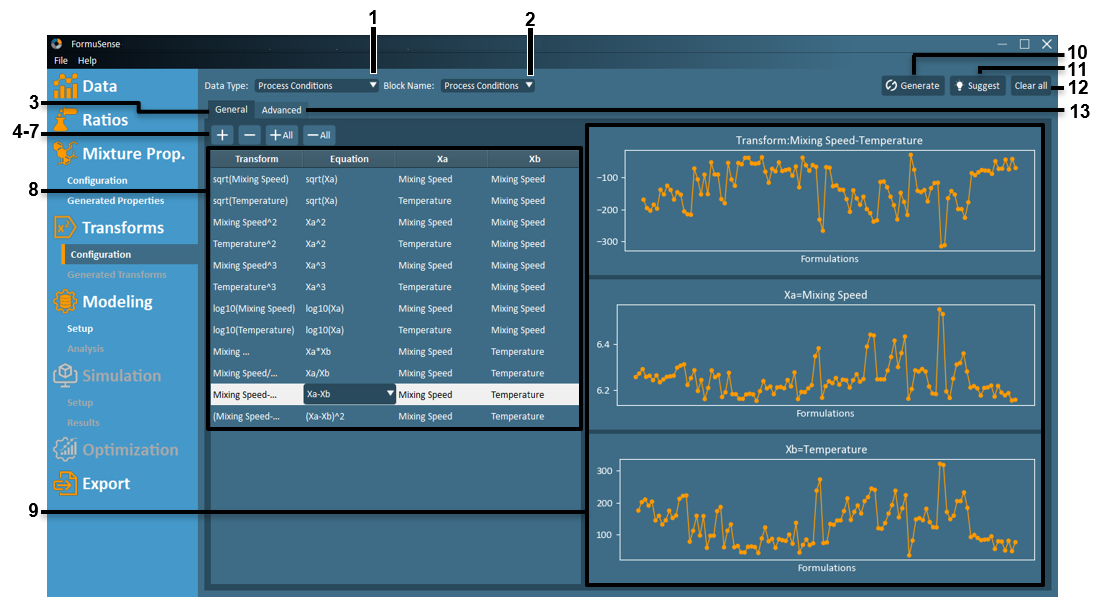
Data Type – View and configure transformations for each data type with this dropdown.
Block Name – View and configure transformations for a sub-block of data within the selected Data Type.
General – View and configure general transformations.
 – New Transform – Add a new transform for the currently selected Data Type and Block Name. After clicking this button, the user may name the new transform, and select which equation and variables to apply.
 – Delete Transform – Delete the transform currently selected in the transform listing.
 – Add All – Add new transforms to represent all possible combinations of equations and variables.
 – Delete All – Delete all transforms displayed in the transform listing.
General Transform Listing – Displays all transforms configured for the current Data Type and Block Name. Users may name or rename each transform from within the Transform Listing, select the desired transformation equation from the available dropdown, and select up to 2 variables to apply the transform.
General Transform Line Plots - Displays a line plot for each variable and the resulting transform for the currently selected transform in the Transform Listing.
Generate - Generates all transforms configured by the user for all Data Types and all Data Blocks. After generating transforms, Generated Transforms in the software navigation menu will become active.
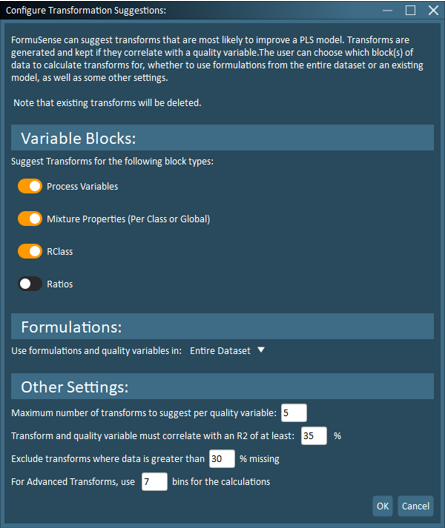
Suggest - This tool will identify data transformations that meet user-defined criteria including: variable blocks of interest, formulations, maximum number of transforms to suggest per quality variable, minimum correlation to a quality variable, maximum acceptable missing data, and number of bins (ranges) for advanced transformations.
Note
Transforms resultant of the Suggest tool are automatically generated.
Important
Any custom-configured transformations, whether generated or not, will be deleted when the Suggest feature is used. If custom transformations and suggested transformations are desired, first generate suggested transforms and then add custom transformations.
Note
Users are cautioned from including the Ratios block in transformation suggestions as this can result in a large number of transformation variables.
Clear All - Deletes all configured data transformations from all Data Types and all Block Names.
Advanced - View and configure advanced transformations. Advanced transforms allow users to generate categorical (binary) variables to represent defined ranges for any variable.
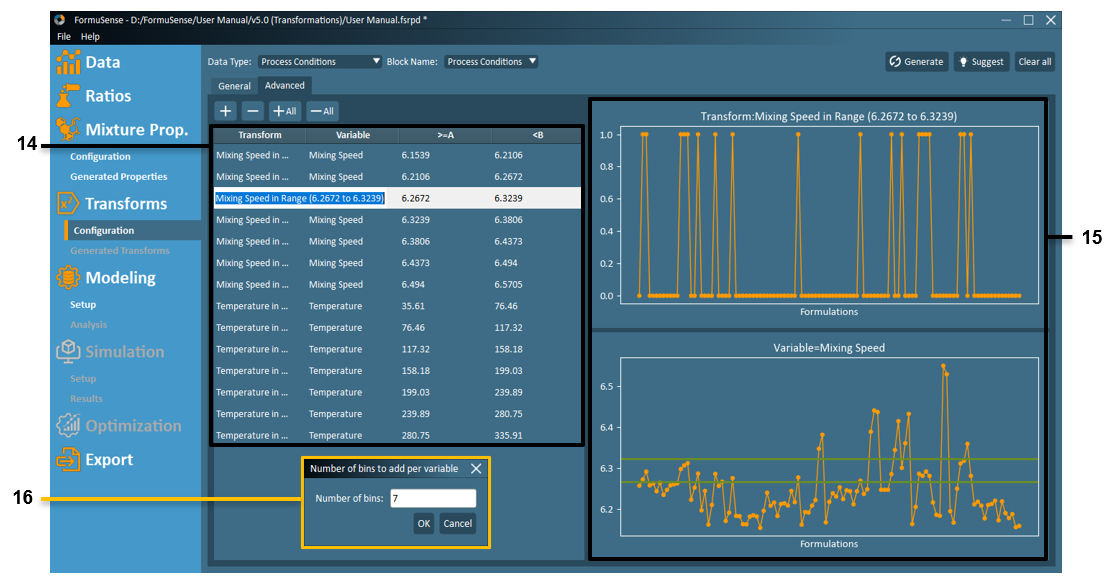
Advanced Transform Listing - Displays all advanced transforms configured for the current Data Type and Block Name. Users may name or rename each transform from within the Transform Listing, select the desired variable from the available dropdown, and specify the range for which a true (1) value should be generated.
Advanced Transform Line Plots - Displays a line plot of the selected variable identifying the specified range for which a true (1) value will be generated, as well as a line plot of the resultant transformation.
Number of Bins - When the +All feature is used in the Advanced Transform configuration, the user is prompted to specify the maximum number of equally spaced bins from which to automatically generate categorical variables. Any bins that contain zero true (1) values will be ignored, therefore the number resulting transformations per variable may be smaller than the number of bins specified.
Note
For advanced transforms on ingredient ratios or ingredient class ratios, a separate bin is automatically created for values equal to zero.
Generated Transforms
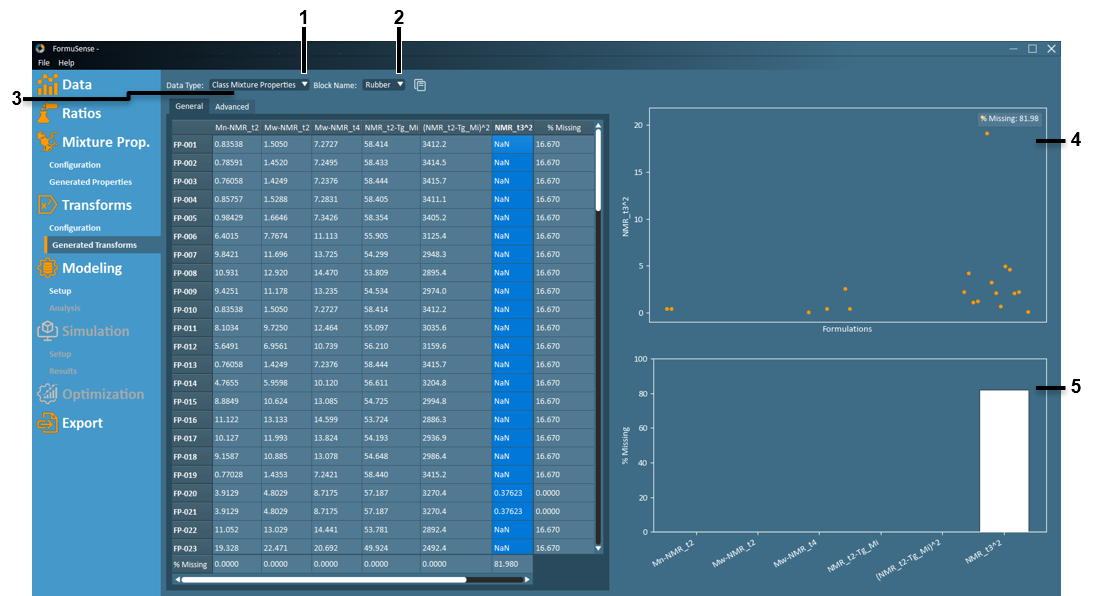
Data Type – View and configure transformations for each data type with this dropdown.
Block Name – View and configure transformations for a sub-block of data within the selected Data Type.
Transformation Results – The results of the configured transformations for the selected Data Type and Block Name are displayed here. If a cell in this table is selected, the entire column will be highlighted and a lineplot of that variable will be populated. The total percentage of missing data (NaN) is displayed at the bottom of each column (per variable) and the end of each row (per formulation).
Transformation Lineplot – A lineplot of the selected column of data is displayed with:
The X axis representing each formulation in order of the table.
The Y axis representing the transformation variable value of the corresponding formulation.
The percentage of missing data across all formulations for the selected property is displayed at the top-right of the plot.
Missing Data Barplot – A barplot of the percentages of missing data for all transformations is displayed, with the current transformation selected highlighted in white.
The X axis lists each transformation variable.
The Y axis displays the percentage of missing data across all formulations.