Modeling
Setup
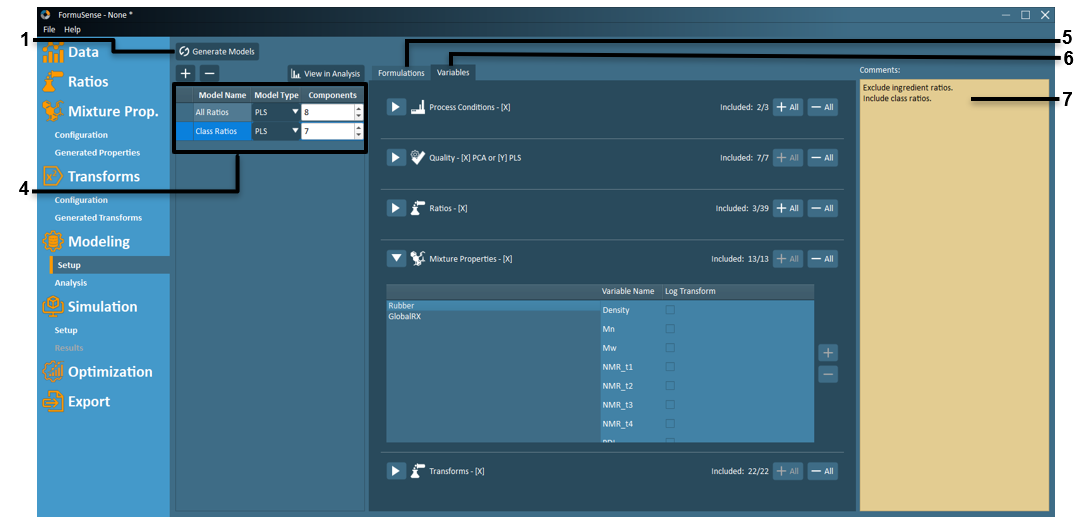
Generate Models – Build multivariate models for all models listed and configured in the Model Listing Box.
 – Create a new model.
 – Delete a selected model.
Model Listing – All configured models are listed here along with the model type and desired number of principal components.
Models can be renamed by double-clicking the Model Name field.
Right-clicking on a model in this list allows users to create a new model using the existing model configuration as the basis.
The Model Type dropdown is used to specify the model type as either PCA or PLS.
Note
PCA models may only contain input variables (X), while PLS models must contain both input variables (X) and outcome variables (Y). When quality variables are included in a PCA model, they are treated as input variables (X). When quality variables are included in a PLS model, they are treated as outcome variables (Y).
The number of principal components can be adjusted away from the auto-specified value using the Components input field.
Note
The number of components is defaulted to the square root of the number of X+Y variables in the model and can be adjusted.
Formulations that are specified as training/validation/removed are listed in the Formulations tab.
Variables that are included/excluded are listed in the Variables tab.
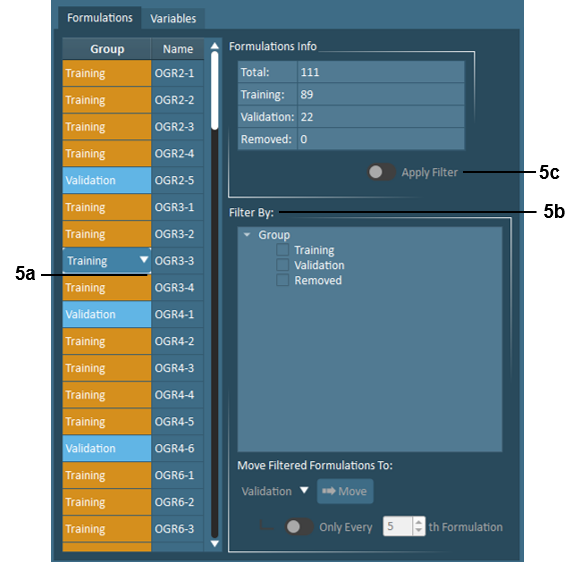
Formulations – In the Formulations tab, Formulations to be used in the training and validation sets when building the model are specified here. Formulations can also be removed from modeling here. By default, every 5th formulation is assigned to the validation set. Users can adjust these defaults using the following tools:
Individual formulations - can be selected as training, validation, or removed by clicking the Group field for the desired formulation and using the dropdown that appears.
Multiple formulations - can be selected as training, validation, or removed by using the filtering tools. If the imported data includes Product Type or any Descriptor Variables, these will also appear as available filters. Users may move all filtered selections or every Nth selection to training, validation, or removed by making use of the toggle and adjustable criteria.
The number of formulations currently assigned to training, validation, and removed are displayed here. Activating the Apply Filter toggle allows users to preview how many formulations from each of training, validation, and removed are within the current filter.
Variable Selection – For each data block, variables may be included or excluded at the user’s discretion, and a logarithmic transform can be applied to any selected variable.
Note
Variables with insufficient variation (≤1e-8) or are ≥90% missing are automatically excluded, and users may not override these settings.
Process Conditions [X] – Each imported block of process variables will be assigned to a separate X (input) process variable block.
Quality - [X] PCA or [Y] PLS – Each imported block of quality variables will be automatically designated to a separate X (input) variable block for PCA models or to a Y (output) variable block for PLS models.
Ratios [X] – Blocks of generated ingredient ratios (grouped per class) and class ratios will appear here. The class ratios are assigned to a single X (input) block, while ingredient ratios are assigned to separate X (input) blocks according to ingredient class. By default, all class ratios are included in new models, while all ingredient ratios are excluded. However, users may adjust these model settings using the + / - buttons.
Note
The decision of whether to include or exclude ingredient ratios is dependent upon the specific application. Generally, ingredient ratios should be excluded from PLS models for any classes where the user would like to consider new ingredients in future formulations. Including ingredient ratios for certain ingredient classes may improve PLS model predictive abilities in the absence of ingredient property data.
Mixture Properties [X] – All generated mixture properties will appear here, and all mixture properties are included by default. Mixture properties are assigned a separate block according to ingredient class.
Transforms [X] – All generated transformations (except transformations on quality variables) will appear here, and all transformations are included in a new model by default. Transformations are assigned to separate blocks according to the location of the original data to which the transformation was applied. Transformations on quality variables will appear as separate blocks in the Quality block.
Log Transform – User may apply a log transformation to any variable through this checkbox feature.
Comments – Users may document model decisions for future reference in this area.
Analysis
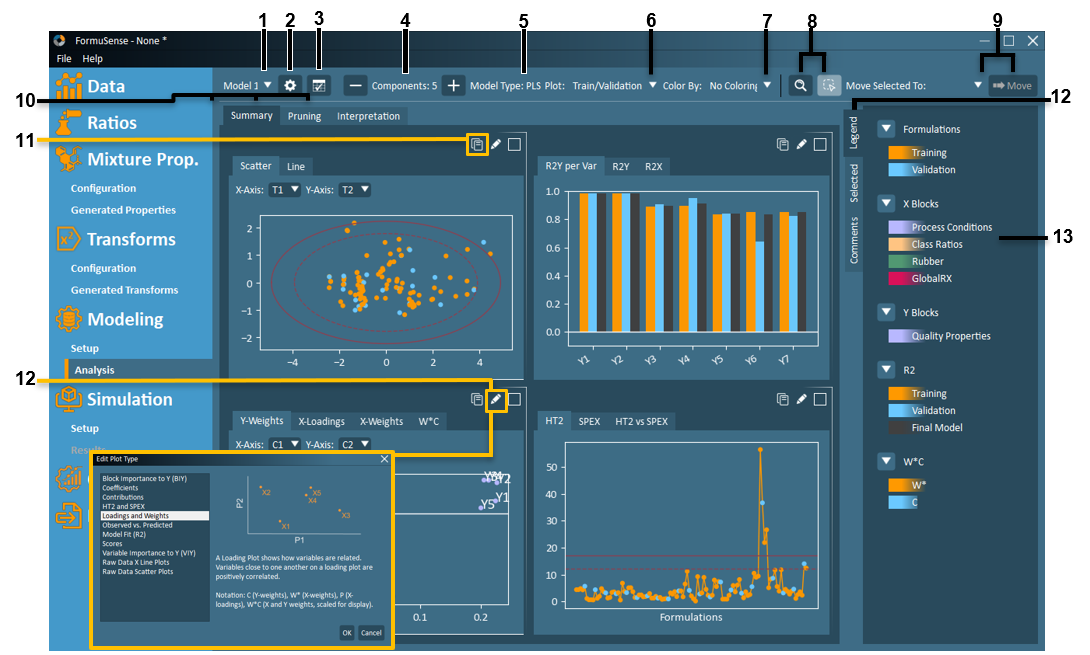
Model Selection – Select which configured model to view in analysis (via drop-down menu). The currently selected model name is displayed.
View Setup – The model configuration settings can be viewed via the View Setup button.
Model Info and Comparison
 – View and copy tabular summary of all configured models. Summary table includes model type, number of principal components, number of variables, number of formulations, and model fit parameters.
Remove/Add Component – The user may choose to remove or add components to the model. If a component is added or removed, the model and analysis will be immediately updated to reflect the modified model.
Model Type – Displays selected model type (PCA or PLS) for model currently being viewed in Modeling Analysis.
Plot Group – In the model analysis plots, FormuSense defaults to plotting the Train/Validation model – which has been trained on the specified training set (orange) and projecting the specified validation set (blue). However, the user can also view the Final Model (model trained on both training + validation sets) from this drop-down menu.
Colour By – If the imported data includes Product Type or Descriptor Variables, then the model analysis plots can be coloured according to these identifiers.
Zoom/Select
 – The user can switch between a zoom tool or selection tool using this pair of buttons. The active tool is identified by the light blue button.
Zoom In – Zoom in on any modeling analysis plot by left-clicking your cursor while dragging to draw a rectangular area of interest. This is shown in yellow in the plot below.
Zoom Out – Zoom out by right-clicking your cursor.
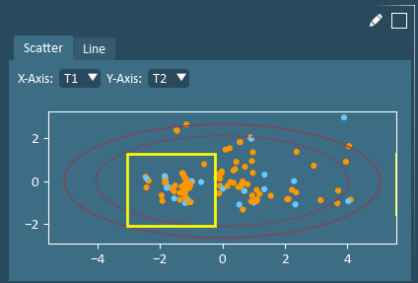
Select - Select one or more formulations or variables by left-clicking your cursor while dragging to draw a region of interest on a single plot, as shown below. Active selections are identified by white colouring, and where relevant, other plots in the current view (summary/pruning/interpretation) are automatically updated to identify the same formulation or variable. Note that both formulation and variable selections can be concurrently activated by making those selections on two different plots.
Unselect – Left-click anywhere on the plot with an active selection.
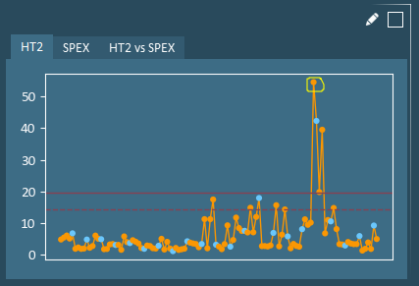
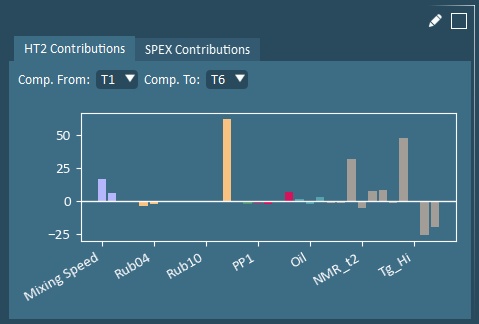
Example: Formulation Selection – In the pruning view shown below, selecting a variable on the score plot will result in the same formulation being highlighted on the HT2 plot and x-variable plot, while the HT2 contributions plot is updated to show contributions from the selected formulation to average.
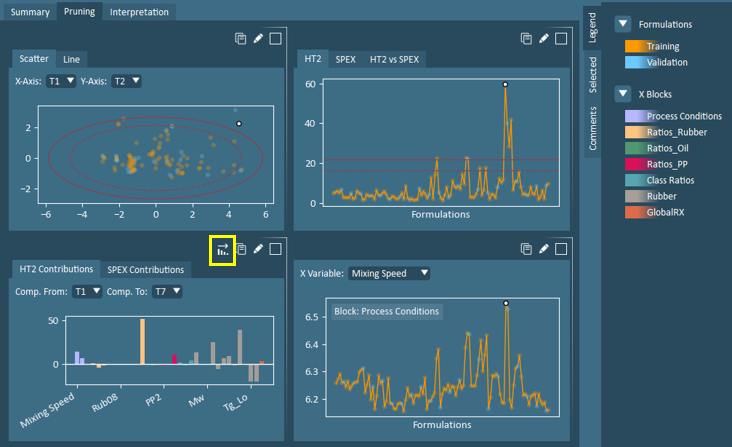
Example (continued): Variable Selection – In the pruning view above with the active formulation selection, the user may then wish to explore the variables with high HT2 contributions. The user may sort the HT2 Contributions plot in ascending order, prior to making a variable selection. With a variable selected, FormuSense will then automatically update the X Variable plot to show the same selected variable.

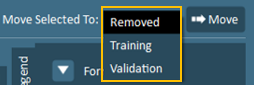
Move Selection – If one or more formulations or variables are selected in the plots, these selections can be removed from the model. If this action is performed, the model will automatically regenerate and the new model will appear. The changes to the model configuration will be reflected in the model setup view. If only formulations are selected (no variables selected), a dropdown will appear allowing the user to move these formulations to training, validation, or removed.
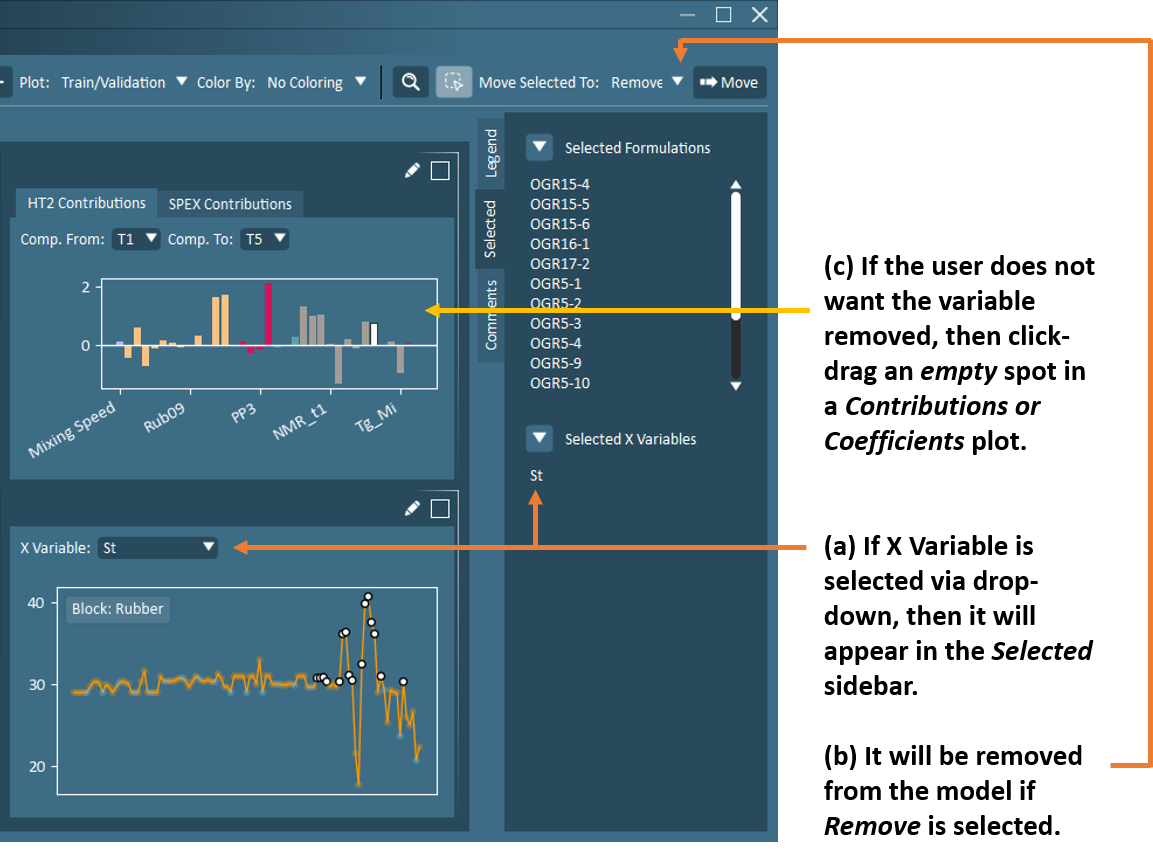
Important
Users should note that if an X variable is selected in the raw X data plot via drop-down and observations are selected, then both the X variable and observations will appear in the Selected sidebar. If the Remove option is selected, then all items in the Selected sidebar will be removed (including the X variable itself). If the user wishes to keep the X variable in the model, then the user must click-drag in an empty area in a Contribution or Coefficient plot to de-select the variable. The variable should then disappear from the Selected sidebar. See below for an example of this occurrence.
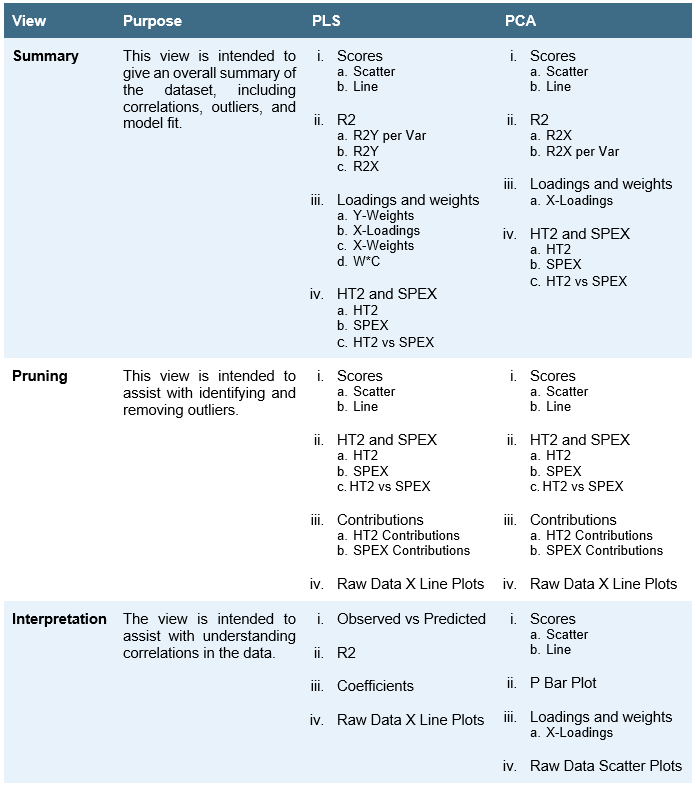
Model Analysis View – Up to four plots can be viewed simultaneously in model analysis. FormuSense includes three pre-configured views with the following purpose and default plots:
Users may reconfigure each view using the Plot Selection (9)
 feature and can maximize an individual plot using the Expand Window (10)
  feature.
Note
All three pre-configured views are restored to the default plots as listed above when the user generates or regenerates a model from the Model Setup, or exits FormuSense.
Copy Plot
 – The displayed plot can be copied to clipboard and then pasted into another file outside of FormuSense.
Plot Selection
– The displayed plot can be selected from the list that appears when clicking the Plot Selection tool. A description of each plot and an example are provided in the plot selection dialogue.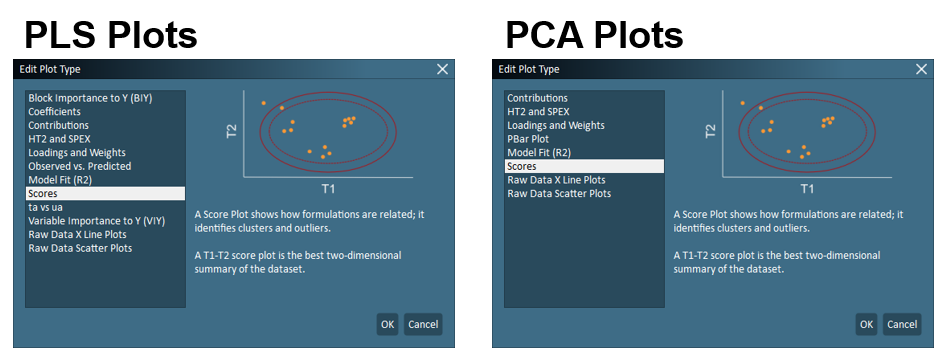
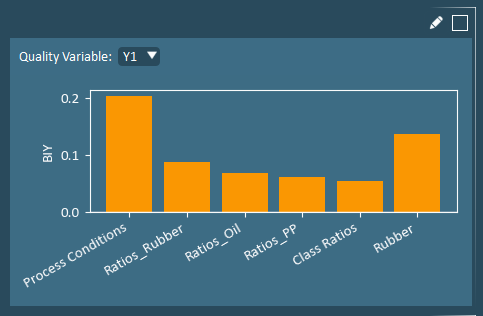
Block Importance to Y (BIY) plot shows the combined impact of all X-variables from a single block to a Y-variable, relative to that of all other blocks. The block with the largest BIY value has the strongest correlation to the Y-variable.
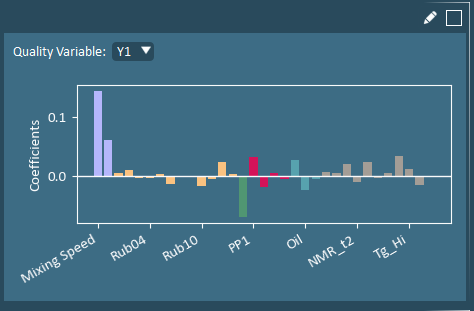
Coefficients identify the simultaneous directional impact of each X-variable on a specific Y-variable. The highest Y-values occur when variables with positive coefficients are higher-than-average, while variables with negative coefficients are simultaneously lower-than-average.
Contributions identify the variables that most significantly differ from the average to the selected formulation(s). Hotelling’s T2 (HT2) Contributions identify variables that are farthest away from their average values. Squared Prediction Error (SPEX) Contributions identify variables with correlation structure inconsistencies (and is only populated when 1 formulation is selected).
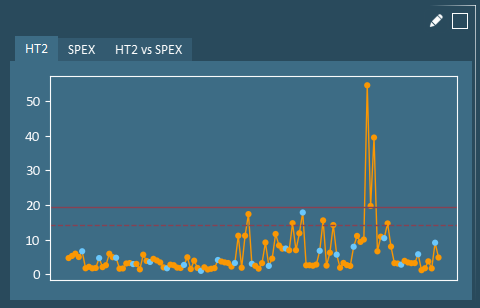
Hotelling’s T2 (HT2) and Squared Prediction Error (SPE) are model validity metrics that are helpful in identifying outliers. HT2 evaluates how extreme a formulation is relative to all others. SPE evaluates how consistent a formulation’s correlation structure is with that of all others.
Loadings and Weights – A Loading Plot shows how variables are related. Variables close to one another on a loading plot are positively correlated.
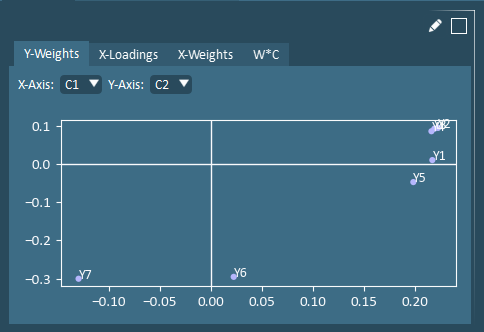
Notation: C (Y-weights), W* (X-weights), P (X-loadings), W*C (X and Y weights).
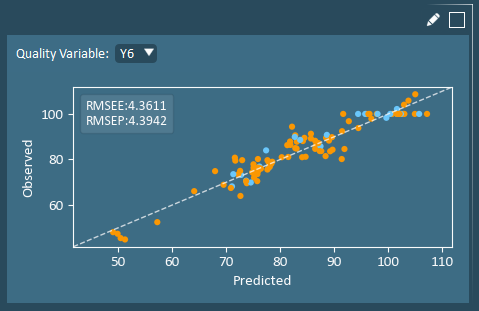
The Observed vs. Predicted plot is used to evaluate the model’s ability to fit an outcome (Y) variable. Experiments falling close to the unity line are well fit. RMSEE is the root mean squared error of estimation (of the training set), while the RMSEP is the RMSE of prediction (of the validation set).
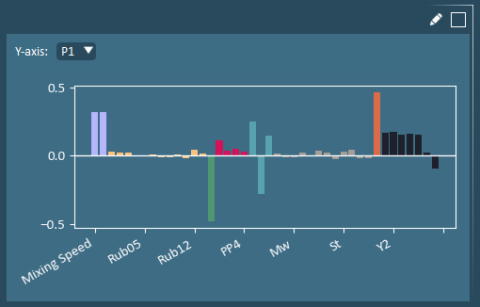
A P Bar Plot shows the x-loadings, which are the optimal weights (P) used to calculate the weighted averages (scores).
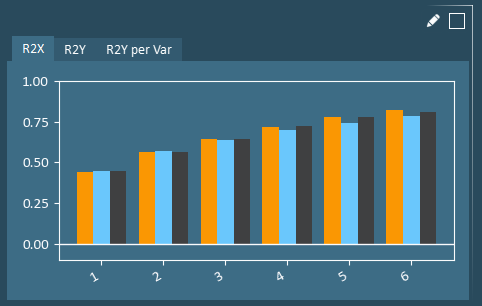
R2 is the Model Fit, with higher R2 indicating a better model fit is achieved. R2 is a measure of how much variability is explained by the model. R2X and R2Y plots show how well the principal components cumulatively describe variation in the X-data and Y-data, respectively. R2Y per Var shows the model fit for each individual Y-variable using all principal components. For the validation data (blue bar), this is a measure of how well the model built on the training data performs on the unseen data in the validation set.
Note
The Y-axis on these plots is fixed to -0.1 to 1.0. Any model with an R2 below 0 is unexpected and likely indicates a significant issue with data integrity and/or a poor validation set.
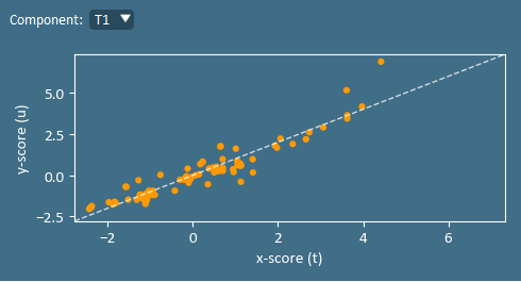
A ta vs ua plot can be used to identify a well-fit motel and the existence of non-linearities. In a perfect model, ta=ua. Note that u values are not calculated for the validation set.
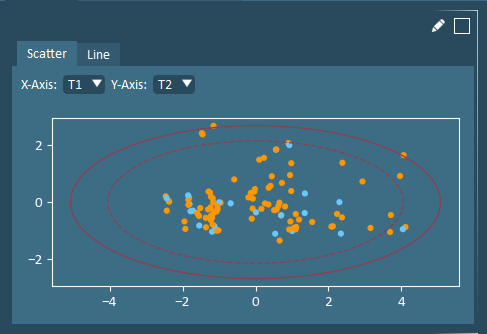
The Score Plot shows how formulations are related; it identifies clusters and outliers. A T1-T2 score plot is the best two-dimensional summary of the dataset.
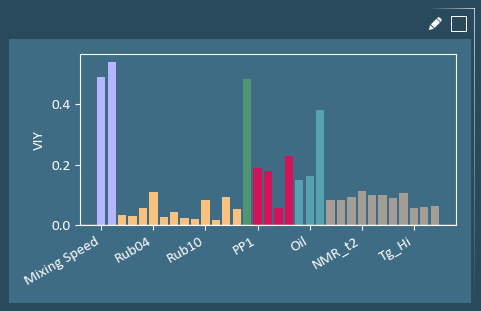
The Variable Importance to Y (VIY) plot summarizes the absolute impact of the X-variables on all Y-variables. The X-variable with the largest VIY value has the strongest correlation to Y-variables. This plot can be useful for variable pruning.
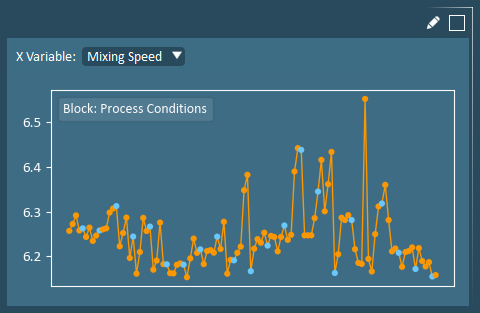
Raw Data X-Line Plots allow users to view an individual input variable (in original units). X-Data line plots can be useful for making selections and for confirming the findings of other analysis plots.
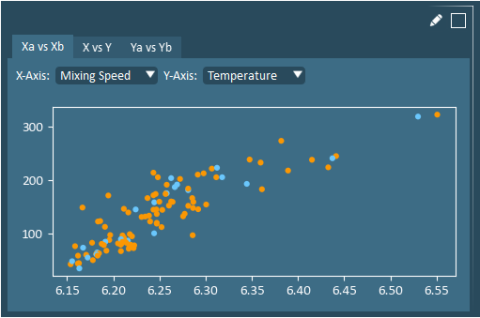
Raw Data Scatter Plots allow users to view any two X or Y variables (in original units). Raw data scatter plots can be useful for confirming the findings of other analysis plots. plots.
Expand Window
- Enlarges a plot to view in greater detail. Revert to the multi-plot view using the minimize icon  .
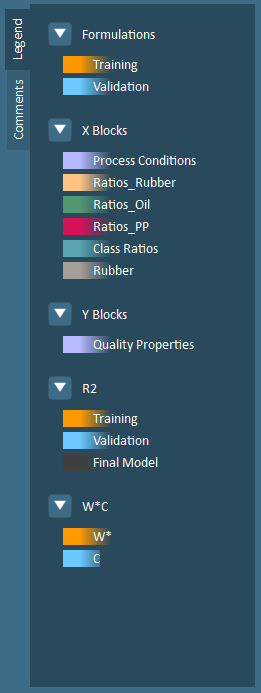
.Comments/Legend – This collapsible window provides a location for users to document notes about model building decisions (such as reasons for removing formulations or variables, key correlations that have been identified by certain plots, etc.) and displays plot coloring information.
Formulations – By default, formulation data points are colored by training (orange) and validation (blue) groups.
X Blocks – Each x-block is assigned a unique color, up to a maximum of 15 blocks.
Y Blocks – Each Y-block is assigned a unique color, up to a maximum of 15 blocks.
R2 – An R2 is provided for training data (orange), validation data (blue), and final models (gray).
W*C – W* (X-weights) are colored orange while C (Y-weights), are colored blue.